Elasticsearch 모니터링
Elasticsearch 모니터링 with Prometheus, Grafana
https://github.com/prometheus-community/elasticsearch_exporter
# cd /usr/local/src
# wget https://github.com/prometheus-community/elasticsearch_exporter/releases/download/v1.6.0/elasticsearch_exporter-1.6.0.linux-amd64.tar.gz

# tar -xvf elasticsearch_exporter-1.6.0.linux-amd64.tar.gz

# ls /usr/local/src/elasticsearch_exporter-1.6.0.linux-amd64
CHANGELOG.md  LICENSE  README.md  dashboard.json  deployment.yml  elasticsearch.rules  elasticsearch_exporter
systemd 작성
/etc/systemd/system/elasticsearch_exporter.service
[Unit]
Description=Prometheus elasticsearch exporter
After=syslog.target network.target

[Service]
User=root
Group=root
ExecStart = /usr/local/src/elasticsearch_exporter-1.6.0.linux-amd64/elasticsearch_exporter --es.uri=http://elastic계정:elastic비밀번호@192.168.10.177:9200 --es.all --es.indices --es.timeout 20s
Restart=always

[Install]
WantedBy=default.target
# systemctl enable elasticsearch_exporter
# systemctl daemon-reload
# systemctl start elasticsearch_exporter
# systemctl status elasticsearch_exporter
exporter 데이터 확인
# curl GET http://localhost:9114/metrics
...
# TYPE promhttp_metric_handler_requests_in_flight gauge
promhttp_metric_handler_requests_in_flight 1
# HELP promhttp_metric_handler_requests_total Total number of scrapes by HTTP status code.
# TYPE promhttp_metric_handler_requests_total counter
promhttp_metric_handler_requests_total{code="200"} 0
promhttp_metric_handler_requests_total{code="500"} 0
promhttp_metric_handler_requests_total{code="503"} 0
/elastic/elasticsearch-8.7.1/config/certs
방화벽 설정
# sudo firewall-cmd --permanent --add-rich-rule='rule family="ipv4" source address=192.168.10.0/24 port port="9114" protocol="tcp" accept'

## 방화벽 재시작
# firewall-cmd --reload
success
# firewall-cmd --list-all
prometheus 적용 후 재시작
scrape_configs:
  - job_name: 'elasticsearch_exporter'
    scrape_interval: 60s
    scrape_timeout:  30s
    metrics_path: "/metrics"
    static_configs:
      - targets: ['192.168.10.177:9114']
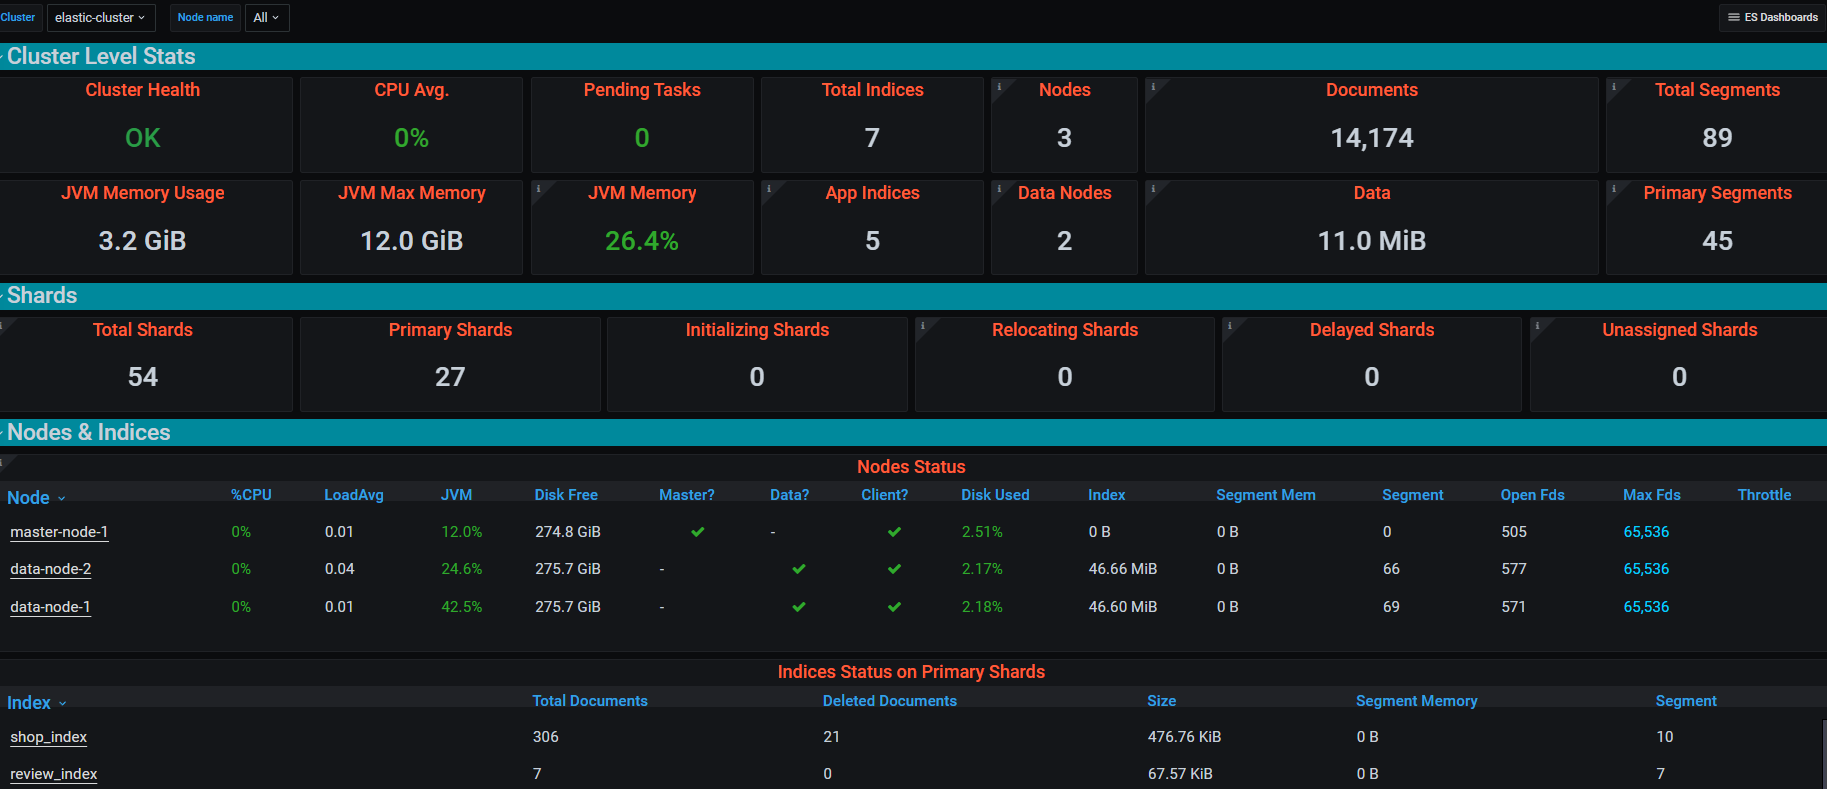
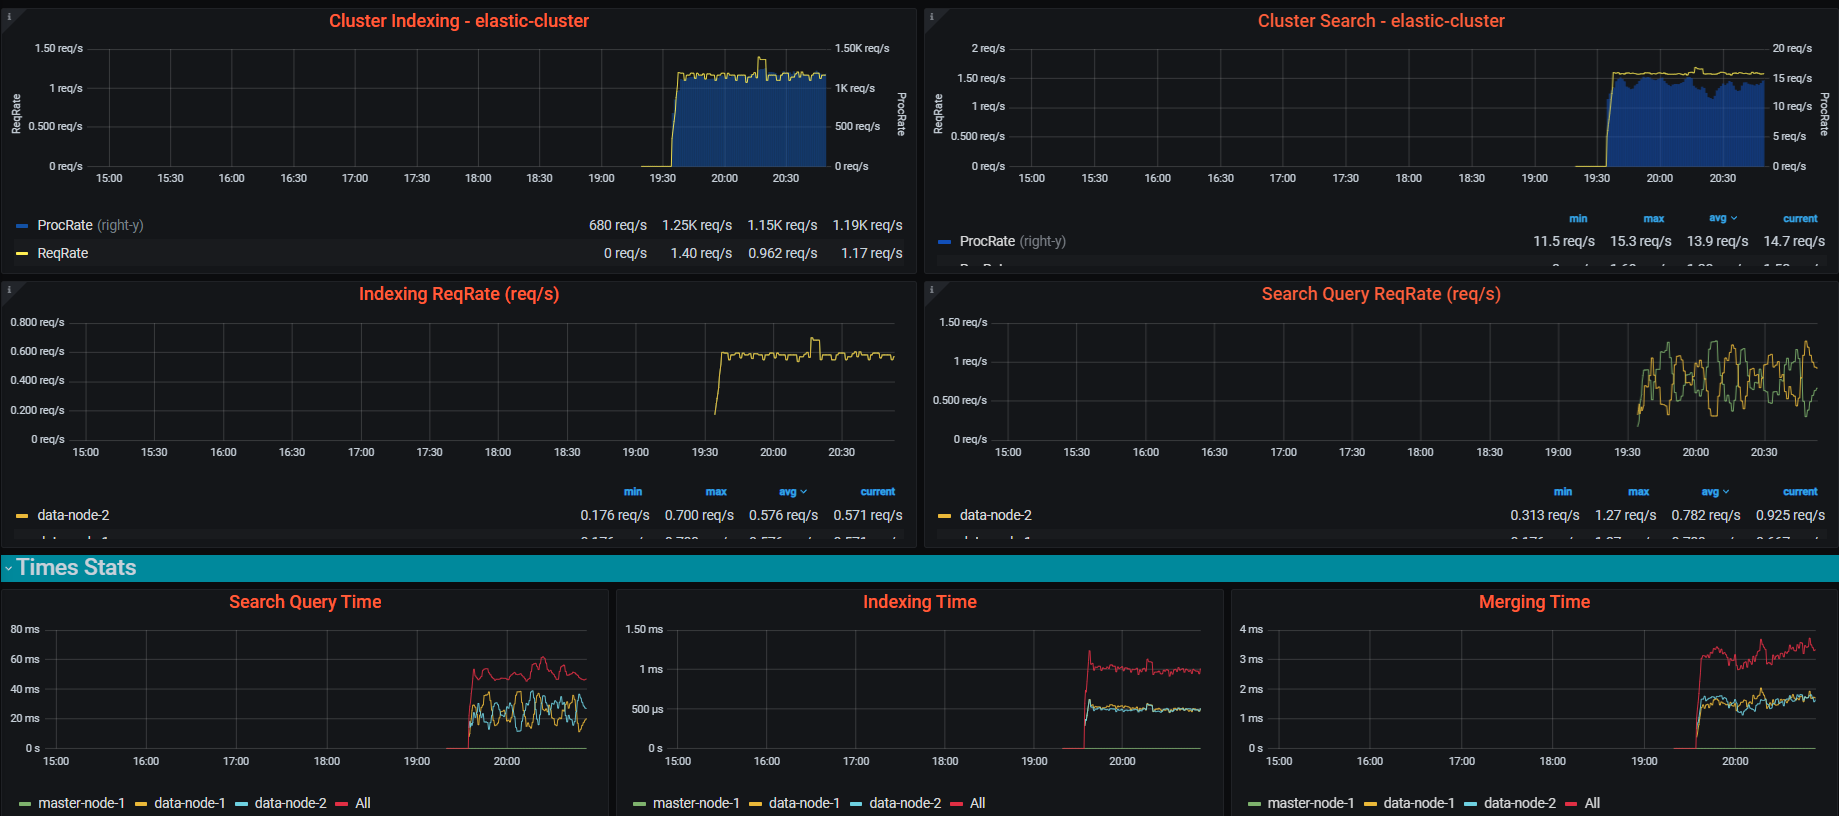
Grafana Dashboard 적용
https://grafana.com/grafana/dashboards/13071-elasticsearch-cluster/
References
https://github.com/prometheus-community/elasticsearch_exporter
https://bidhankhatri.com.np/elk/monitoring-elasticsearch-cluster/
댓글남기기