서버 모니터링 Prometheus, Grafana
서버 모니터링 필요한 이유
서비스의 품질에 있어 성능 이슈나 장애로 인해 고객이 불편을 겪지 않도록 하는 것은 매우 중요하기 때문에 서비스가 실행 중인 서버에 대한 모니터링이 필수 입니다.
개발자나 운영팀에서 많은 서버들의 상태를 24시간 감시할수 없기 때문에 고객을 통해 장애를 인지하는 경우가 많고 그 만큼 서비스 중단 시간이 길어집니다. 서비스의 중단 시간이나 빈도가 많아질 수록 기업의 신뢰도가 낮아집니다. 이러한 문제들을 해결하기 위해서는 자동화된 모니터링 시스템을 통해 경고나 장애의 알람을 받고 대응하여 서비스의 중단을 최소화 시켜야 합니다. 또한 모니터링을 통해 수집된 정보를 토대로 서버의 증설 유무나 인프라 계획을 수립할 수 있습니다. 데이터를 기반으로 의사결정이 가능하기 때문에 좀 더 정확한 의사결정을 할 수 있습니다.
추가적으로 모니터링과 더불어 인프라적인 failOver나 장애 발생를 유발할 수 있는 개발 코드 검증도 필요 합니다.
서버 모니터링 솔루션으로 prometheus 선택
많은 유료와 오픈소스 기반의 모니터링 솔루션들이 있습니다. 그 중 prometheus를 선택한 이유는 아래와 같습니다.
-
Apache 2 라이센스의 오픈소스
-
http pull 방식으로 다양한 서버에서 CPU, Memory, Disk, Traffic, Process, JVM 등 정보를 수집하기 때문에 모니터링 시스템에 장애가 발생해도 실제 사용중인 서비스에 영향이 없다는 장점.
-
다양한 exporter를 제공하고 내부에서 제공하는 Web UI 뿐만 아니라 Grafana와 같은 시각화 툴을 이용하여 볼 수 있다는 점.
-
kubernetes의 docker 환경에서 서비스의 메트릭을 수집하고 분석하는데 많이 사용됨.
-
대중적이고 커뮤니티 활성화
-
자동 알림을 제공
-
time series data 기반 솔루션
prometheus 외에도 오픈소스 솔루션으로 scouter, munin, sensu, fluentd 등이 있습니다.
prometheus를 사용하기전에 고려해야될 사항들
prometheus는 metric 정보를 일정 간격마다 pull 방식으로 각 서버에 접속하여 정보를 수집해오는 방식이기 때문에 모든 이벤트를 수집해야되는 서비스에는 적합하지 않고 CPU/메모리/파일시스템 현황, 컨테이너 현황 등 특정 데이터의 흐름을 파악하는데 용이합니다. 또한 네트워크 속도에 따라 pull 방식의 수집 시 딜레이가 발생하여 즉각적인 파악이 힘들 수 있습니다. 그리고 수집 대상이 늘어날수록 디스크가 부족할 수도 있습니다. 따라서 여러대의 prometheus 서버를 분산시키고 수집하는 서버의 수를 적절히 분배해야 됩니다. 이와 관련해서 prometheus는 Federation이라는 hierarchy 구조로 구성하는 방법을 제안하지만 특정 prometheus 서버가 장애 또는 패치 등 의해 shutdown되면 그 시간 동안에는 매트릭을 수집할 수 없다는 단점을 가지고 있습니다. 이러한 문제를 해결하기 위해서는 Prometheus Operator 또는 Thanos와 prometheus 서버를 조합하여 사용 것을 검토해야 합니다.
수집 서버를 추가해야 될 경우 prometheus 서버를 재시작해야되는데 재시작이 발생할 수 있는 리스크가 있는지 고려해야 됩니다.
prometheus(프로메테우스)
https://prometheus.io/
prometheus는 오픈소스 모니터링 툴이이며 리소스로부터 metirc을 수집하고 해당 메트릭을 이용해서 모니터링하는 기능을 제공합니다. 또한 이상 증세가 발생했을 때 slack이나 여타 다른 webhook을 이용해서 알림을 주는 등 다양한 기능을 제공하고 있습니다.
기본적인 프로세스는 Prometheus server에서 각 노드(서버)들에 접근하여 각 노드들이 수집한 정보들을 가져오는(pull) 방식입니다.
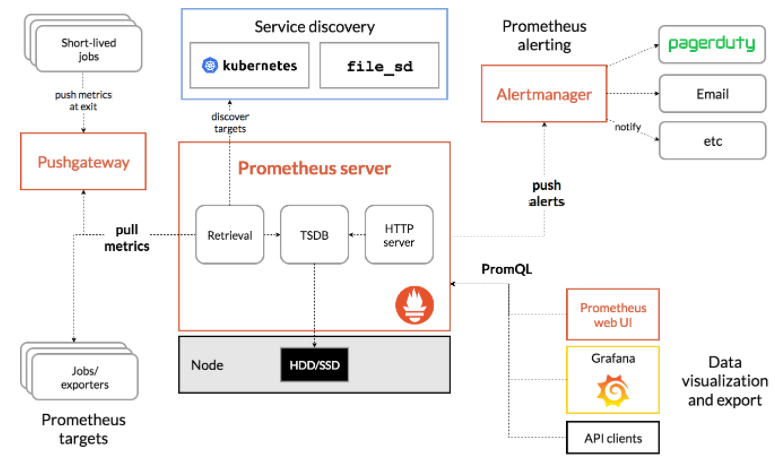
Component
Client Libraries - 응용 프로그램 코드를 계측하기 위한 클라이언트 라이브러리입니다.
exporters - exporter는 실질적으로 모니터링 대상으로부터 메트릭을 수집하는 컴포넌트로 데이터를 수집하여 prometheus가 exporter로 metric을 요청 했을 때 메트릭을 전송하는 역할을 하게 됩니다. (https://prometheus.io/docs/instrumenting/exporters/)
Prometheus Server - prometheus.yml에 scrape job으로 등록된 exporter가 열어둔 http endpoint에 접속하여 exporter가 수집한 metric을 prometheus server에 저장하게 됩니다. 이때 저장되는 metric은 분산처리가 되지 않기 때문에 단일 노드에 저장되며, prometheus는 기본적으로 15일이 지난 이전의 metric은 삭제하기 때문에, 이를 고려하여 적절한 storage 용량을 할당하는 것이 중요합니다.
Pushgateway - 해당 어플리케이션에 접근하지 못할 때, 어플리케이션이 게이트웨이에 데이터를 push하고 이를 다시 프로메테우스 서버에서 가져오는 경우에 사용합니다.
Alertmanager - Metric을 통해 지표를 설정하고 그에 맞는 규칙을 설정해 slack, hipchat, email 등을 통해 알람을 전송하는 역할을 합니다.
Features
SoundCloud에서 제작된 오픈소스시스템 모니터링 및 알림 툴킷.
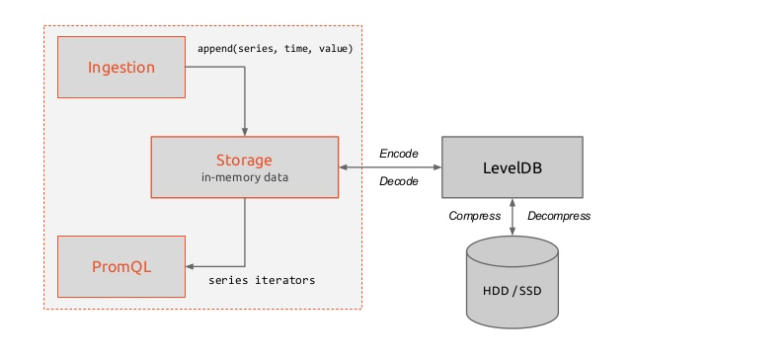
메트릭 이름 및 키/값 쌍으로 식별된 시계열 데이터를 포함하는 다중 차원 데이터 모델.(LevelDB)
다차원 차원성을 활용할 수 있는 유연한 쿼리 언어(PromQL)
분산 스토리지에 의존하지 않음.
시계열 수집은 HTTP를 통한 pull 모델을 통해 수행.
그래프 작성 및 대시보드 지원의 여러 가지 모드
모니터링 노드에 설치된 Prometheus는 Web API로 연결되어 각 노드를 브라우저에서 직접 참조
Support
Linux, Windows OS
.NET, C++, Go, Haskell, Java, Node.js, Python, Ruby
sharding
federation Replication
RESTful HTTP and JSON
Prometheus 모듈
Retrival
메트릭을 수집할 대상 서버에 exporter가 제공하는 http endpoint에 접근해서 메트릭을 가져오거나, Pushgateway를 통해 접근할 수 없는 사내망 같은 곳에 존재하는 데이터를 외부에서 scrape 해야될 때 사용합니다.
TSDB(Time-series Database)
수집된 메트릭 데이터를 시간의 흐름에 따라 조회할 수 있는 시-계열 데이터(time-series)를 저장소에 저장합니다. default로 Local Storage를 사용하며 필요에 따라 원격지에 있는 서버에 데이터를 저장할 수 있습니다.
HTTP Server
prometheus는 데이터를 가져가기 위한 HTTP REST API를 제공하며 Web UI 대시보드나 Grafana를 통해 더욱 자세하고 깔끔한 데이터 시각화화면으로 조회를 할 수 있습니다.
Promethues
Prometheus Server를 설치할 서버에 접속
다운로드
# cd /usr/local/src
# wget https://github.com/prometheus/prometheus/releases/download/v2.27.1/prometheus-2.27.1.linux-amd64.tar.gz
# tar -xvf prometheus-2.27.1.linux-amd64.tar.gz
# cd prometheus-2.27.1.linux-amd64/
설정
# vim prometheus.yml
# my global config
global:
  scrape_interval:     15s # Set the scrape interval to every 15 seconds. Default is every 1 minute.
  evaluation_interval: 15s # Evaluate rules every 15 seconds. The default is every 1 minute.
  # scrape_timeout is set to the global default (10s).

# Alertmanager configuration
alerting:
  alertmanagers:
  - static_configs:
    - targets:
      # - alertmanager:9093

# Load rules once and periodically evaluate them according to the global 'evaluation_interval'.
rule_files:
  # - "first_rules.yml"
  # - "second_rules.yml"

# A scrape configuration containing exactly one endpoint to scrape:
# Here it's Prometheus itself.
scrape_configs:
  # The job name is added as a label `job=<job_name>` to any timeseries scraped from this config.
  - job_name: 'prometheus'

    # metrics_path defaults to '/metrics'
    # scheme defaults to 'http'.

    static_configs:
    - targets: ['localhost:9090']
global (기본적인 전역설정)
- scrape_interval : 얼마나 자주 메트릭(targets)을 수집할지 설정. 기본 1분
- evaluation_interval : 얼마나 자주 규칙(rules)을 평가할지 설정. 기본 1분
scrape_configs (메트릭을 수집할 엔드포인트로 여기서는 prometheus 서버 자신을 가리키는 설정을 했다. 여러개 설정이 가능하다.)
- job_name : 잡 이름 설정
- static_config : 긁어하는 방법에 대한 목표 및 파라미터 세트를 지정.
static_configs: targets 속성으로 여러개의 수집 서버를 지정할 수 있고 localhost:9090는 prometheus server를 수집하는 설정입니다. (자기 자신을)
*EndPoint: 요청을 받아 응답을 제공하는 서비스를 사용할 수 있는 지점, API가 서버의 리소스에 접근할 수 있도록 가능하게 하는 URL.
prometheus server 기본실행
# ./prometheus –config.file=prometheus.yml level=info ts=2021-06-01T06:42:33.890Z caller=main.go:388 msg=”No time or size retention was set so using the default time retention” duration=15d level=info ts=2021-06-01T06:42:33.890Z caller=main.go:426 msg=”Starting Prometheus” version=”(version=2.27.1, branch=HEAD, revision=db7f0bcec27bd8aeebad6b08ac849516efa9ae02)”
…
prometheus server 중지
| # ps -ef | grep prometheus |
root 1231 30542 0 16:55 pts/6 00:00:00 grep –color=auto prometheus root 32154 1 0 15:50 pts/5 00:00:05 ./prometheus
# kill -9 32154
prometheus server 서비스 등록하기
위에서 기본실행처럼 할 수도 있지만 서버 재시작 이슈도 있고 쉽게 사용할수 있는 서비스로 등록합니다.
# vim /etc/systemd/system/prometheus.service
[Unit]
Description=Prometheus Server
Documentation=https://prometheus.io/docs/introduction/overview/
After=network-online.target

[Service]
User=root
Restart=on-failure
ExecStart=/usr/local/src/prometheus-2.27.1.linux-amd64/prometheus \
  --config.file=/usr/local/src/prometheus-2.27.1.linux-amd64/prometheus.yml \
  --storage.tsdb.path=/usr/local/src/prometheus-2.27.1.linux-amd64/data \
  --web.enable-admin-api

[Install]
WantedBy=multi-user.target
서비스 실행
# sudo systemctl daemon-reload
# sudo systemctl start prometheus
# sudo systemctl status prometheus
● prometheus.service - Prometheus Server Loaded: loaded (/etc/systemd/system/prometheus.service; static; vendor preset: disabled) Active: active (running) since 화 2021-06-01 17:19:30 KST; 36s ago Docs: https://prometheus.io/docs/introduction/overview/ Main PID: 1788 (prometheus) CGroup: /system.slice/prometheus.service └─1788 /usr/local/src/prometheus-2.27.1.linux-amd64/prometheus –config.file=/usr/local/src/prometheus-2.27.1.linux-amd64/prometheus.yml –storage.tsdb.
재부팅시 Prometheus 서비스 자동 실행 설정
# sudo systemctl enable prometheus
방화벽 설정
prometheus가 실행되면 9090포트로 http 서비스가 실행됩니다. 외부에서 Grafana 또는 브라우저에서 접근하기 위한 방화벽을 열어줍니다.
# sudo firewall-cmd –permanent –add-rich-rule=’rule family=”ipv4” source address=106.xxx.xxx.0/24 port port=”9090” protocol=”tcp” accept’
# firewall-cmd –reload
# firewall-cmd –list-all
접속확인
# curl -X GET http://localhost:9090
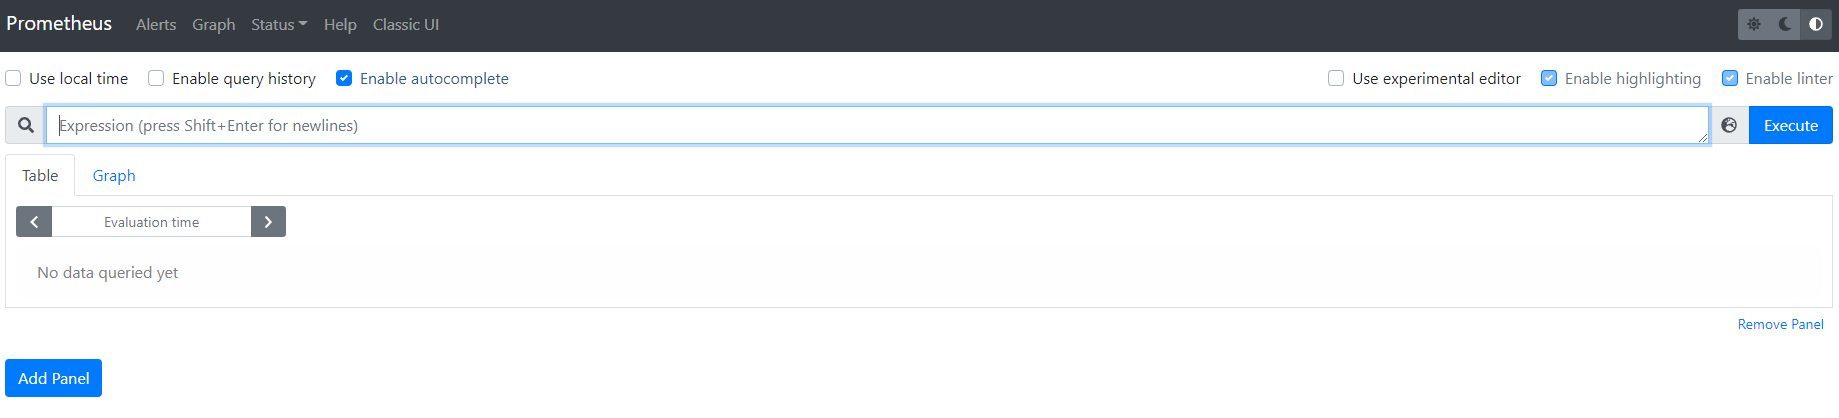
Promethus Web UI 접속
http://211.xxx.xxx.xxx:9090/
Node Exporter
https://prometheus.io/docs/guides/node-exporter/
Node Exporter는 cpu, memory, bandwidth와 같은 다양한 하드웨어 및 커널 관련 메트릭를 제공하며 *nix 계열 시스템용입니다.(Window용 Exporter도 있습니다.)
현재 자신의 모니터링 지표를 http://localhost:9100/metrics 엔드포인트로 제공하고, 원격지에 위치한 Prometheus 중앙 서버에서는 각 인스턴스의 엔드포인트를 특정 주기 단위로 호출하여 시계열 데이터를 수집할 수 있습니다.
Prometheus Server와 하드웨어 관련 메트릭을 수집할 서버에 node exporter를 설치합니다.
*nix exporter download: https://prometheus.io/download/#node_exporter
window exporter download: https://github.com/prometheus-community/windows_exporter
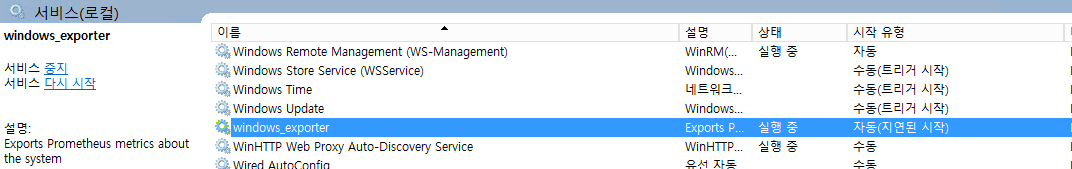
window exporter 설치방법: https://github.com/prometheus-community/windows_exporter#installation
window exporter 설치 후 확인: http://localhost:9182/metrics
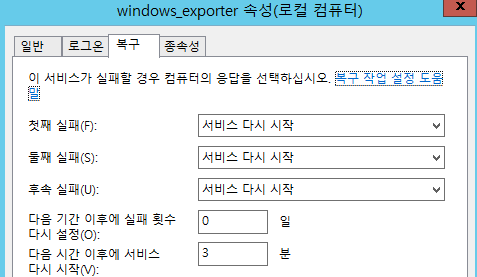
window exporter 설치 후 서비스 재시작 설정 변경
1~3분정도 지연 시작을 해줘야 재부팅 후 정상적으로 로드 됩니다.
prometheus 서버에서 확인: curl -X GET http://222.xxx.xxx.xxx:9182/metrics
다운로드 설치
# cd /usr/local/src
# wget https://github.com/prometheus/node_exporter/releases/download/v1.1.2/node_exporter-1.1.2.linux-amd64.tar.gz
# tar -xvf node_exporter-1.1.2.linux-amd64.tar.gz
node exporter 서비스 등록하기
# vim /etc/systemd/system/node_exporter.service
[Unit]
Description=Prometheus Node Exporter
Documentation=https://prometheus.io/docs/guides/node-exporter/
Wants=network-online.target
After=network-online.target

[Service]
User=root
Restart=on-failure
ExecStart=/usr/local/src/node_exporter-1.1.2.linux-amd64/node_exporter

[Install]
WantedBy=multi-user.target
Node Exporter 서비스 시작
# sudo systemctl daemon-reload
# sudo systemctl start node_exporter
# sudo systemctl status node_exporter
재부팅시 Node Exporter 서비스 자동 실행 설정
# sudo systemctl enable node_exporter
node exporter 접속 확인
# curl -X GET http://211.xxx.xxx.xxx:9100/metrics
# curl -X GET http://localhost:9100/metrics
prometheus.yml 수정
# vim /usr/local/src/prometheus-2.27.1.linux-amd64/prometheus.yml
...
scrape_configs:
...
- job_name: 'window_server_node_exporter'
    static_configs:
    - targets: ['222.xxx.xxx.xxx:9182']
  - job_name: 'linux_server_node_exporter'
    static_configs:
    - targets: ['211.xxx.xxx.6:9100', '211.xxx.xxx.9:9100']
prometheus server 재시작
# sudo systemctl restart prometheus
# sudo systemctl status prometheus
node exporter방화벽 설정
외부의 Grafana 또는 브라우저에서 9100포트로 http 서비스에 접근하기 위한 방화벽을 열어줍니다.
# sudo firewall-cmd --permanent --add-rich-rule='rule family="ipv4" source address=106.xxx.xxx.0/24 port port="9100" protocol="tcp" accept'

# sudo firewall-cmd --permanent --add-rich-rule='rule family="ipv4" source address=211.xxx.xxx.0/24 port port="9100" protocol="tcp" accept'

# firewall-cmd --reload

# firewall-cmd --list-all
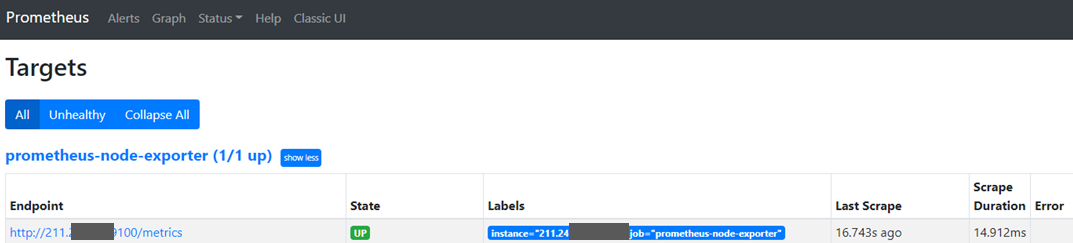
prometheus Web UI에서 node exporter 확인
http://211.xxx.xxx.xxx:9090/targets
# free -h
              total        used        free      shared  buff/cache   available
Mem:           7.6G        609M        5.3G        376M        1.8G        6.4G
Swap:           17G        768K         17G
| Metric | Meaning |
|---|---|
rate(node_cpu_seconds_total{mode="system"}[1m\]) |
The average amount of CPU time spent in system mode, per second, over the last minute (in seconds) |
node_filesystem_avail_bytes |
The filesystem space available to non-root users (in bytes) |
rate(node_network_receive_bytes_total[1m\]) |
The average network traffic received, per second, over the last minute (in bytes) |
Redis Metrics Exporter
https://github.com/oliver006/redis_exporter
# cd /usr/local/src
go build를 사용하기 위해서 go를 먼저 설치합니다.
# wget https://golang.org/dl/go1.16.4.linux-amd64.tar.gz
# tar -xvf go1.16.4.linux-amd64.tar.gz
# export PATH=$PATH:/usr/local/src/go/bin
# source ~/.bash_profile
# go version
go version go1.16.4 linux/amd64
Redis Exporter 설치
# git clone https://github.com/oliver006/redis_exporter.git
# cd redis_exporter/
# go build .
# ./redis_exporter –version
INFO[0000] Redis Metrics Exporter «< filled in by build »> build date: «< filled in by build »> sha1: «< filled in by build »> Go: go1.16.4 GOOS: linux GOARCH: amd64
Redis Exporter 서비스 등록하기
# vim /etc/systemd/system/redis_exporter.service
[Unit]
Description=Prometheus Redis Exporter
Documentation=https://github.com/oliver006/redis_exporter
Wants=network-online.target
After=network-online.target

[Service]
User=root
Restart=on-failure
ExecStart=/usr/local/src/redis_exporter/redis_exporter \
    -web.listen-address ":9121" \
    -redis.password "test1234"

[Install]
WantedBy=multi-user.target
Redis Exporter 서비스 시작
# sudo systemctl daemon-reload
# sudo systemctl start redis_exporter
# sudo systemctl status redis_exporter
재부팅시 Redis Exporter 서비스 자동 실행 설정
# sudo systemctl enable redis_exporter
prometheus.yml 수정
# vim /usr/local/src/prometheus-2.27.1.linux-amd64/prometheus.yml
...

scrape_configs:
  - job_name: 'session_server_redis_exporter'
    static_configs:
      - targets:
          - redis://211.xxx.xxx.6:6379
          - redis://211.xxx.xxx.6:6380
          - redis://211.xxx.xxx.6:6381
    metrics_path: /scrape
    relabel_configs:
      - source_labels: [__address__]
        target_label: __param_target
      - source_labels: [__param_target]
        target_label: instance
      - target_label: __address__
        replacement: 211.xxx.xxx.6:9121
...
prometheus server 재시작
# sudo systemctl restart prometheus
# sudo systemctl status prometheus
# curl -X GET http://127.0.0.1:9121/metrics
Redis exporter방화벽 설정
# sudo firewall-cmd --permanent --add-rich-rule='rule family="ipv4" source address=106.xxx.xxx.0/24 port port="9121" protocol="tcp" accept'

# sudo firewall-cmd --permanent --add-rich-rule='rule family="ipv4" source address=211.xxx.xxx.0/24 port port="9121" protocol="tcp" accept'

# firewall-cmd --reload

# firewall-cmd --list-all
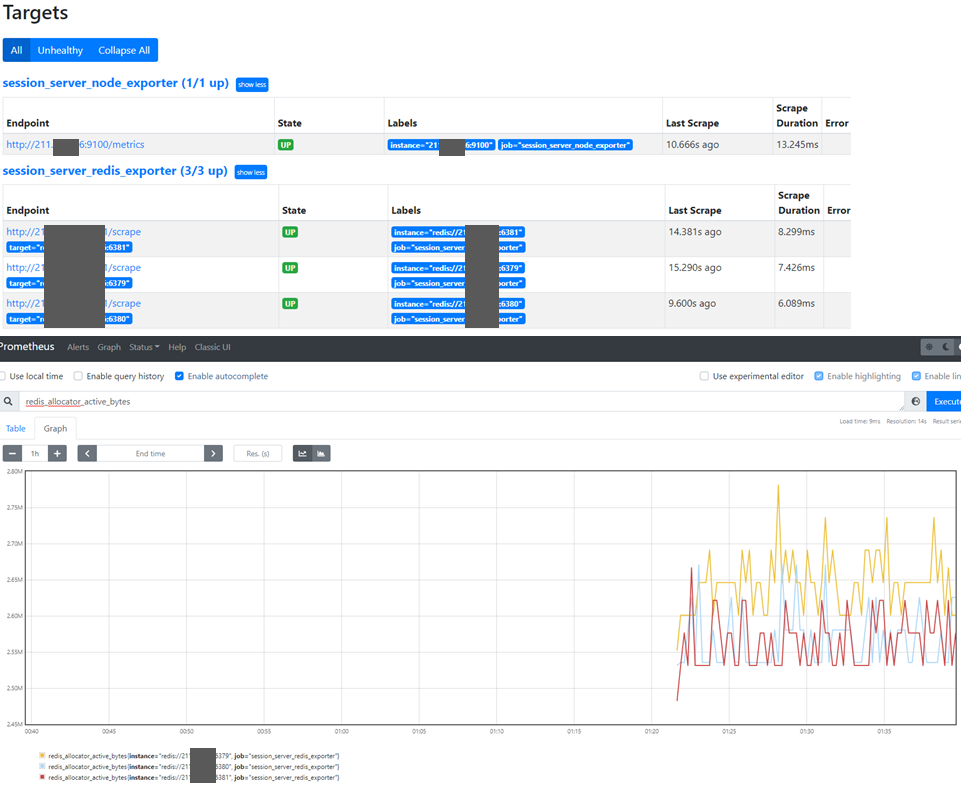
Prometheus Web UI에서 확인
Prometheus 데이터 삭제, 정리 API
관리 API 활성화는 default로 disable되어 있으며 prometheus 서비스에서 기동시 –web.enable-admin-api 파라메터를 추가 해줘야 되기 때문에 서비스 등록시에 이부분을 추가해야 합니다.
레이블과 일치하는 시계열 데이터 삭제
curl -X POST -g 'http://localhost:9090/api/v1/admin/tsdb/delete_series?match[]={foo="bar"}'
특정 Job이나 인스턴스의 시계열 데이터 삭제
curl -X POST -g 'http://localhost:9090/api/v1/admin/tsdb/delete_series?match[]={job="solution_postal"}'

curl -X POST -g 'http://localhost:9090/api/v1/admin/tsdb/delete_series?match[]={instance="127.0.0.1:9100"}'
시계열 데이터 전체 삭제
curl -X POST -g 'http://localhost:9090/api/v1/admin/tsdb/delete_series?match[]={__name__=~".+"}'
delete_series API는 데이터가 즉시 삭제하지 않고 컴팩션(compaction)이 실행될때 정리됩니다. 즉시 데이터를 정리하고 싶다면 clean_tombstones API를 호출하면 됩니다.
curl -X POST -g 'http://localhost:9090/api/v1/admin/tsdb/clean_tombstones'
이 외에도 다음과 같이 사용할 수 도 있습니다.
curl -X POST -g 'http://localhost:9090/api/v1/admin/tsdb/delete_series?match[]=a_bad_metric&match[]={region="mistake"}'

curl -X POST -g 'http://localhost:9090/api/v1/admin/tsdb/delete_series?match[]=node_exporter:memory:percent'

curl -X POST -g 'http://localhost:9090/api/v1/admin/tsdb/delete_series?match[]=node_filesystem_free_percent'

curl -X POST -g 'http://localhost:9090/api/v1/admin/tsdb/delete_series?match[]=node_memory_MemFree_percent'

curl -X POST -g 'http://localhost:9090/api/v1/admin/tsdb/delete_series?match[]=ALERTS'

curl -X POST -g 'http://localhost:9090/api/v1/admin/tsdb/delete_series?match[]=ALERTS_FOR_STATE'
Grafana
Grafana는 비즈니스 및 IT 인프라에 대한 통합된 뷰를 제공하여 시계열 데이터를 더 잘 이해할 수 있도록 지원하는 다양한 시각화 옵션을 제공합니다. PromQL을 이용해서 Prometheus에서 시각화할 metric을 선택적으로 request 하고 이를 시각화 합니다.
Grafana 설치
https://grafana.com/grafana/download
https://grafana.com/docs/grafana/latest/installation/rpm/#2-start-the-server
# cd /usr/local/src
# wget https://dl.grafana.com/oss/release/grafana-7.5.7-1.x86_64.rpm
# sudo yum install grafana-7.5.7-1.x86_64.rpm
# sudo systemctl daemon-reload
# sudo systemctl start grafana-server
# sudo systemctl status grafana-server
# sudo systemctl enable grafana-server
Grafana 삭제
sudo systemctl stop grafana-server
sudo yum erase grafana-7.5.7-1.x86_64
rm -f /var/lib/grafana/grafana.db
Grafana 방화벽 설정
# sudo firewall-cmd --permanent --add-rich-rule='rule family="ipv4" source address=106.xxx.xxx.0/24 port port="3000" protocol="tcp" accept'

# firewall-cmd --reload

# firewall-cmd --list-all
Grafana log
# vim /var/log/grafana/grafana.log
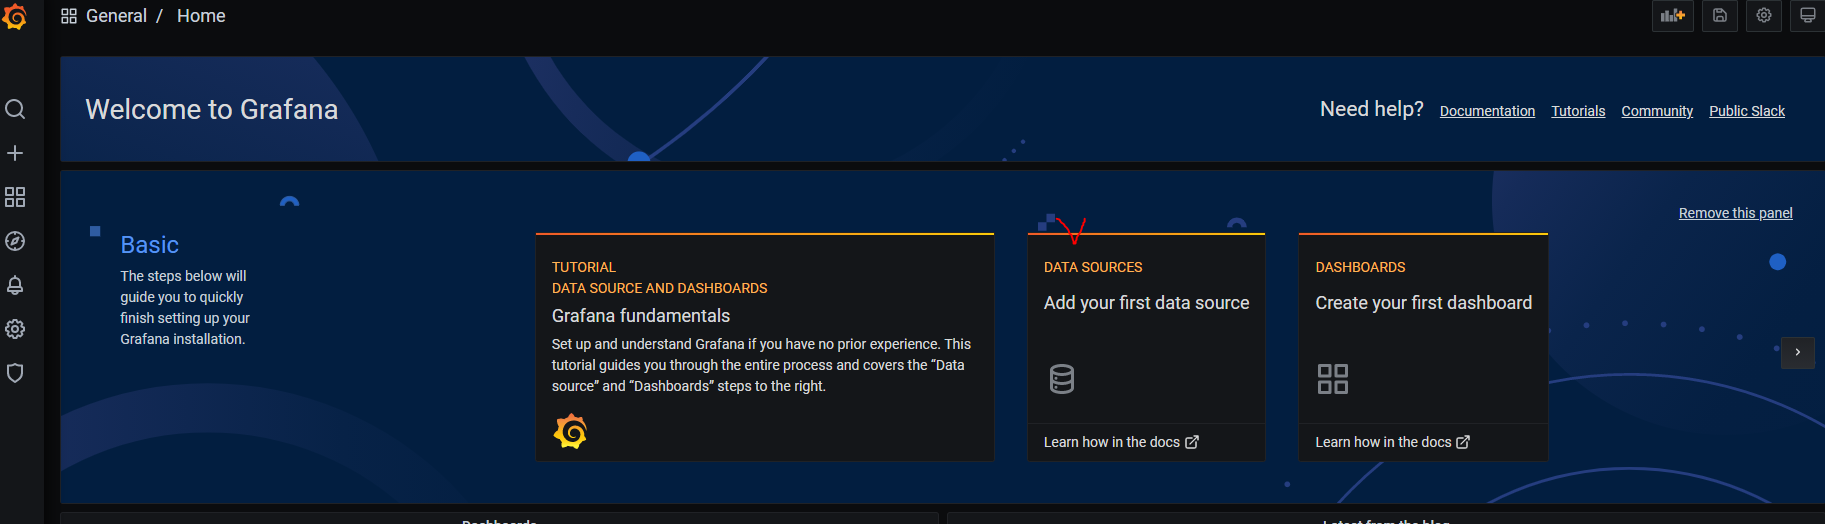
Grafana Web UI 접속
http://211.xxx.xxx.9:3000/
admin / admin 으로 접속
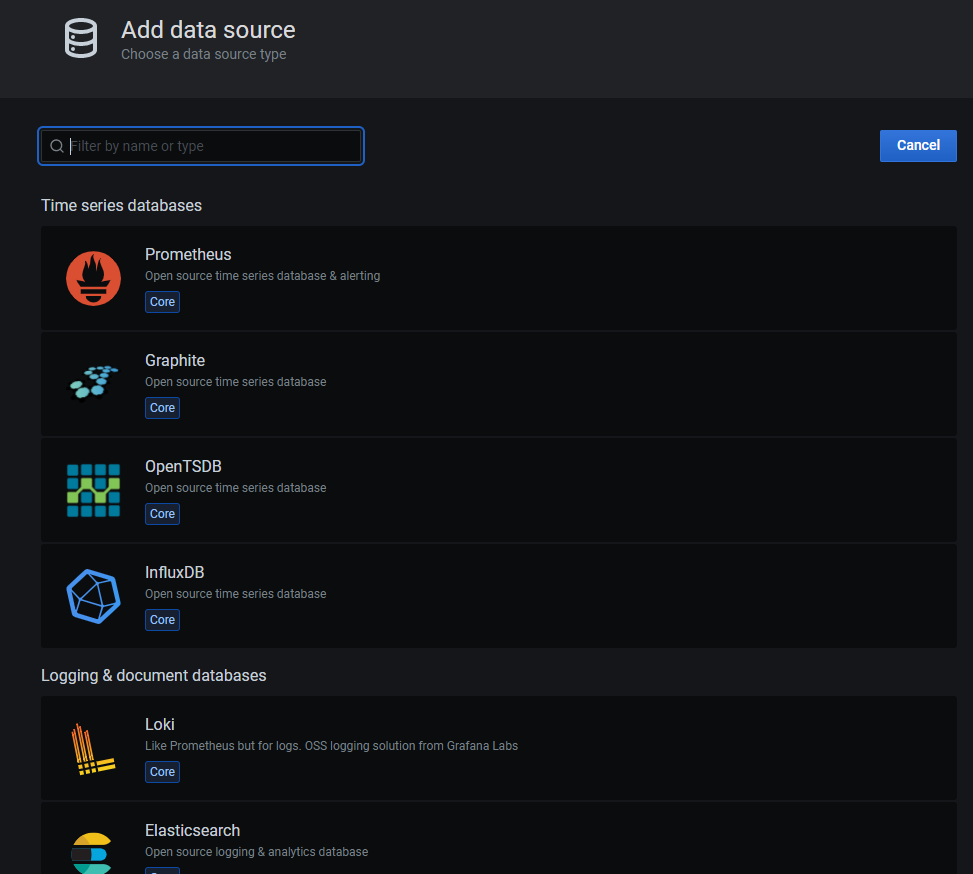
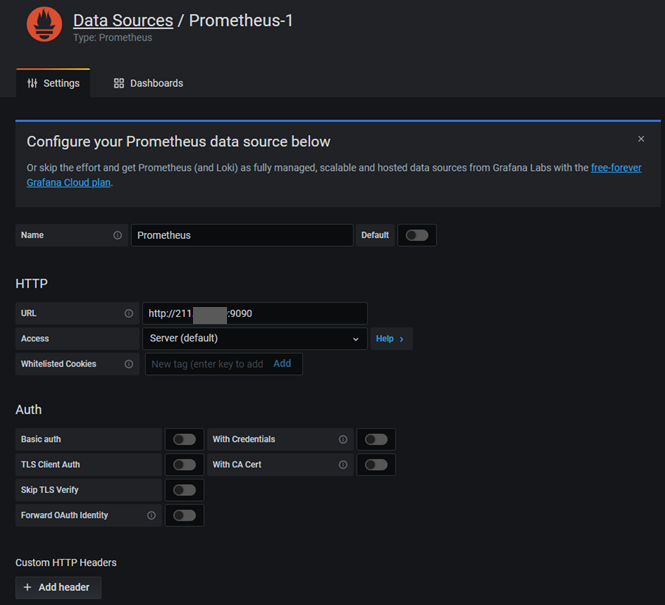
Prometheus Datasource 추가
Grafana Dashboard Custom Css 적용하기
grafana home path는 /usr/share/grafana이고, scss 경로는 /usr/share/grafana/public/sass
rpm 설치버전은 빌드된 버전이므로 github에서 grafana를 clone한 다음 수정하고 재빌드해야 합니다.
node.js, yarn 설치
git clone https://github.com/grafana/grafana.git
수정 후 빌드
생성된 public/build 디렉토리를 /usr/share/grafana/public/build로 복사
grafana 재시작
Prometheus Dashboard 추가
grafana 홈페이지에서 다양한 dashboard를 검색하고 쉽게 사용할 수 있습니다.
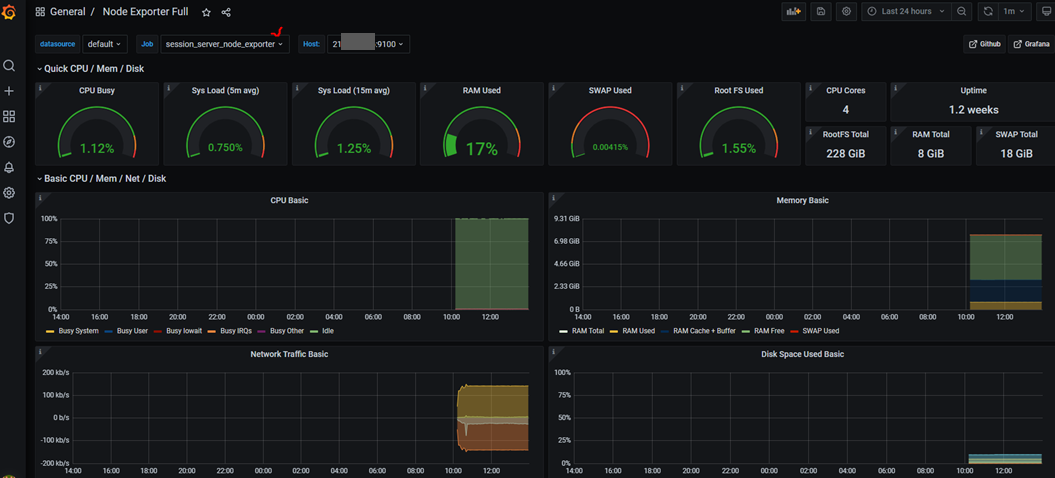
node exporter full
https://grafana.com/grafana/dashboards?direction=desc&orderBy=downloads&dataSource=prometheus
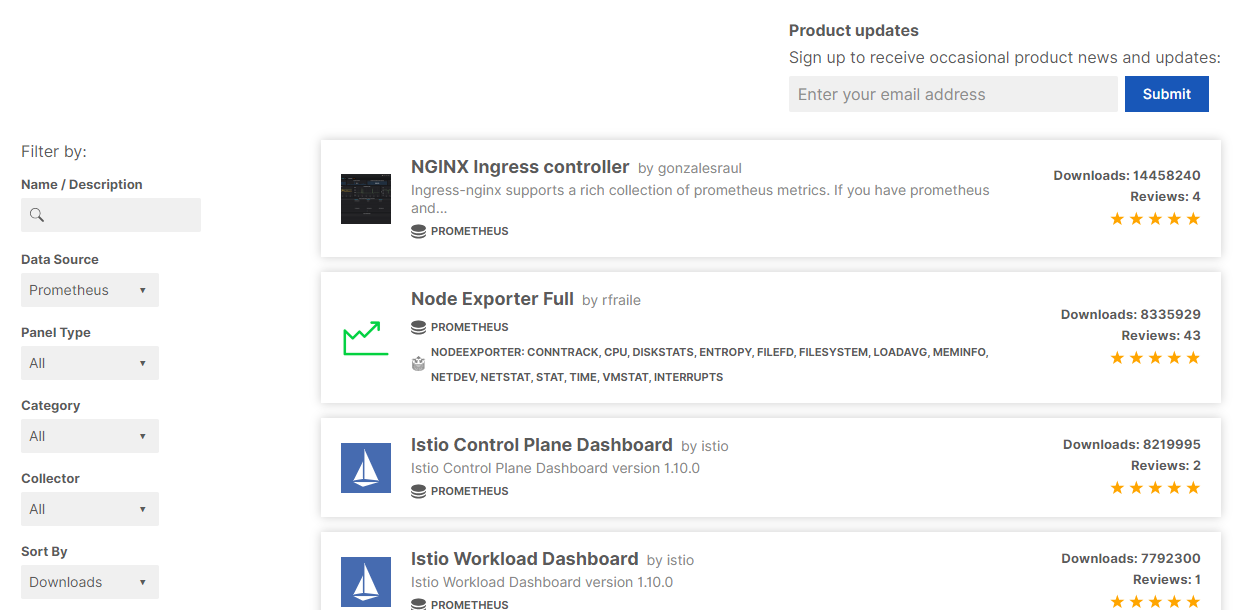
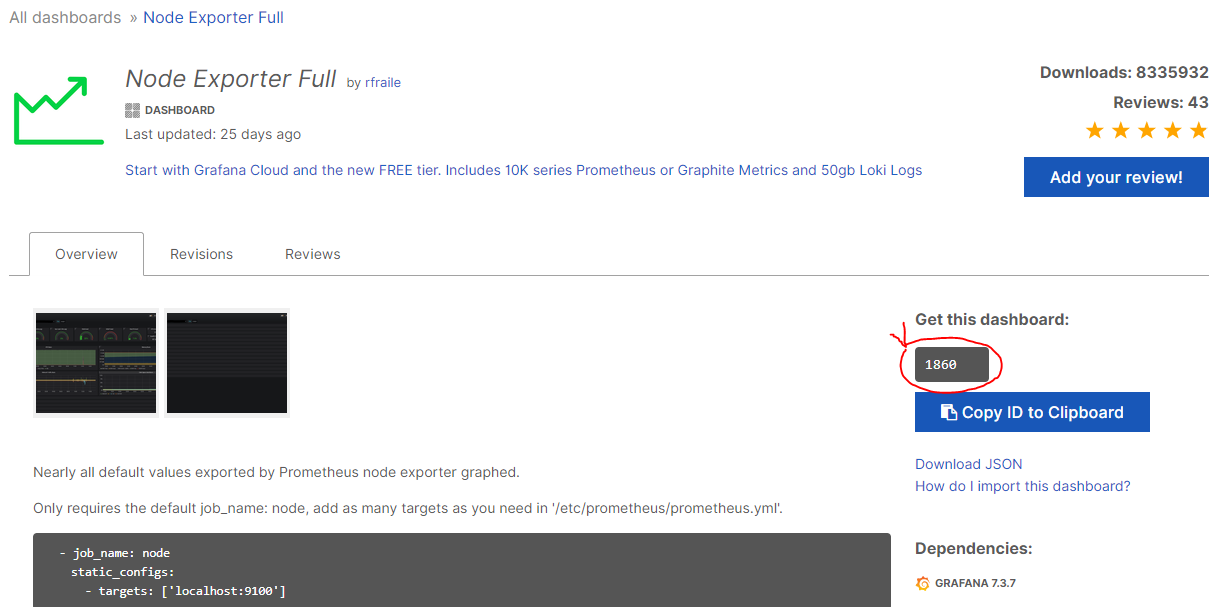
prometheus Dashboard 중 다운로드수가 많은 Node Exporter Full을 클릭하고 상세화면에 dashboard code를 복사합니다.
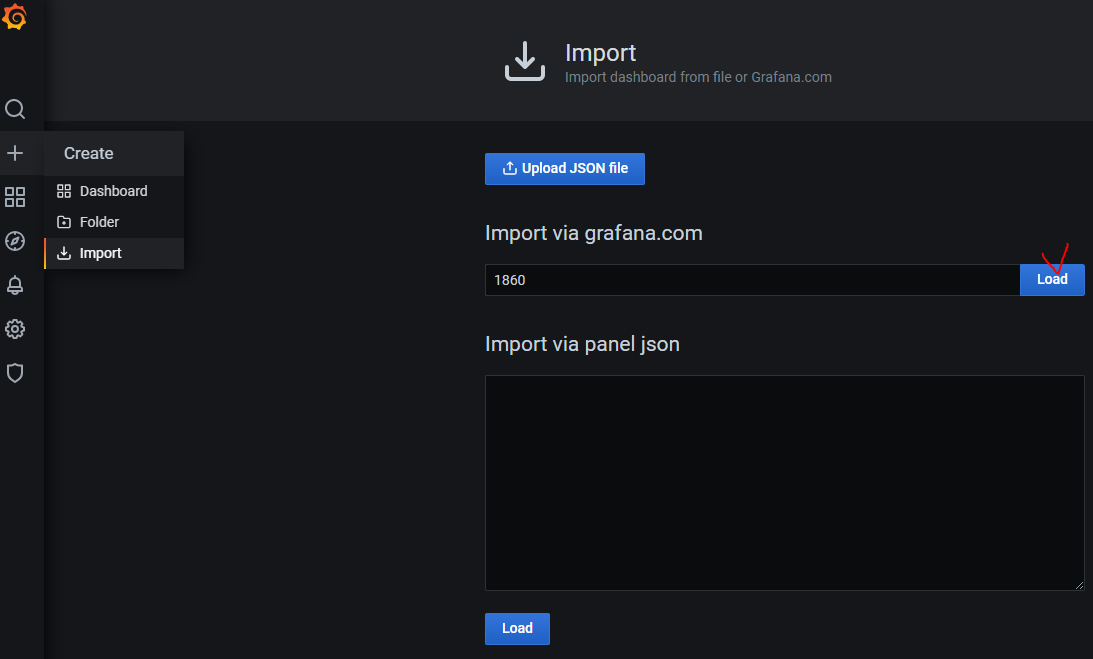
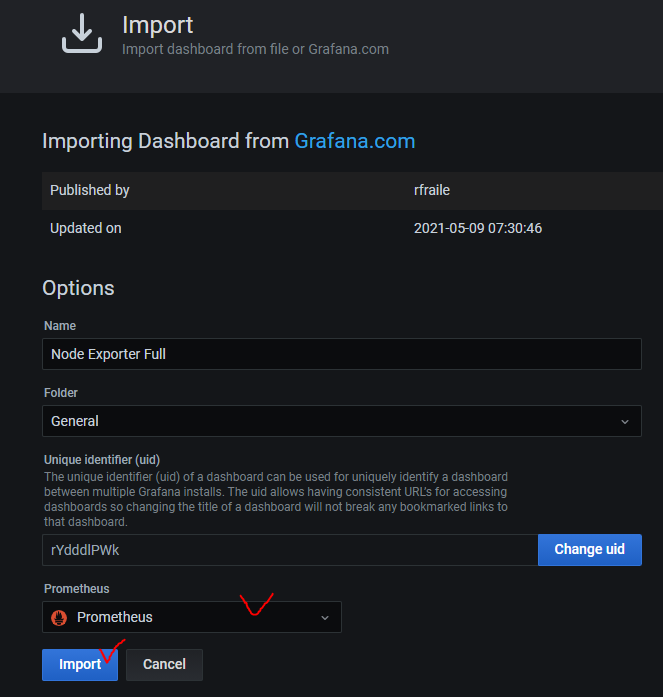
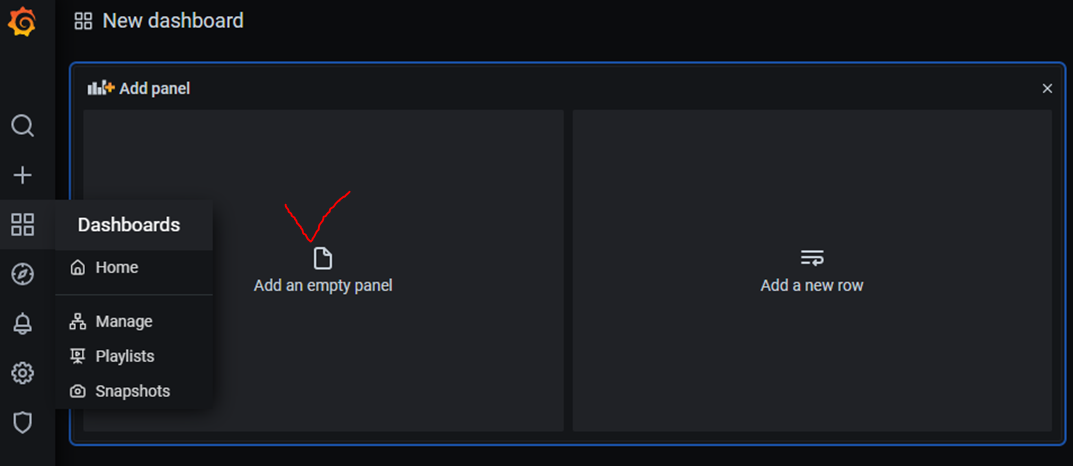
좌측 패널에서 +아이콘 - Import에서 dashboard 코드를 입력한 다음 Load 버튼을 클릭합니다.
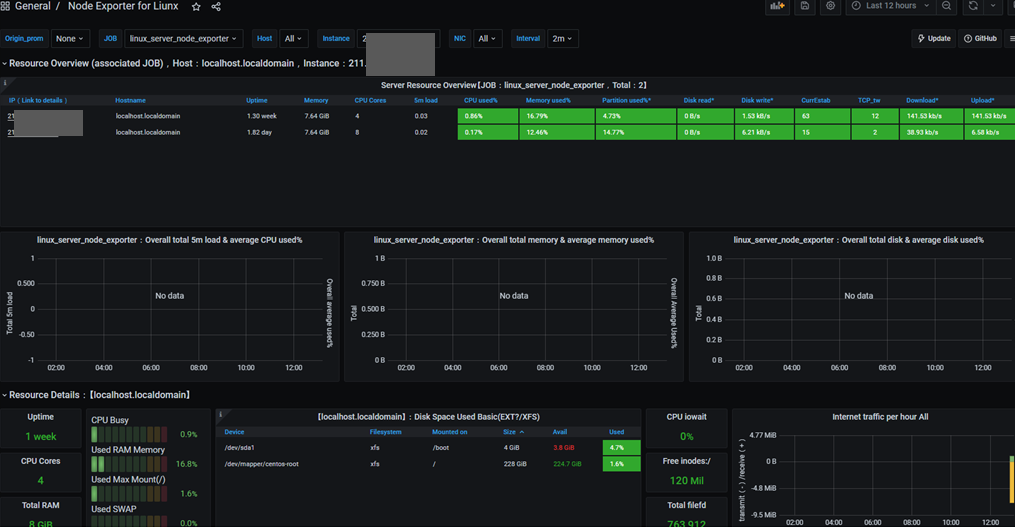
Node Exporter for Prometheus Dashboard EN
node exporter full과 같이 추천할만한 node exporter dashboard입니다.
https://grafana.com/grafana/dashboards/11074
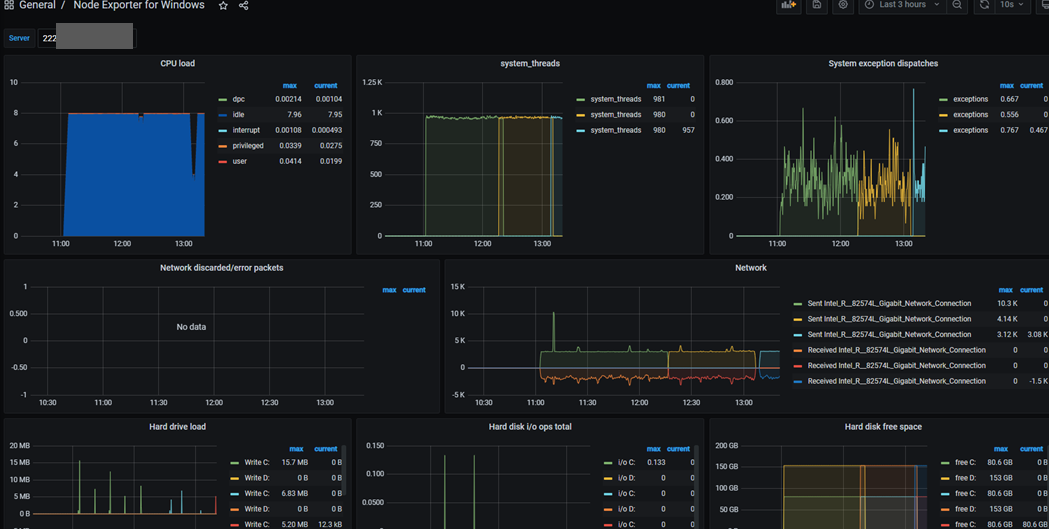
Window Server Node Exporter
위에 두개의 node exporter dashboard는 window exporter가 되지 않아서 window server용 dashboard를 추가했습니다.
https://grafana.com/grafana/dashboards/12422
Prometheus에 연결된 Redis 확인을 위해 dashboard 추가
https://grafana.com/grafana/dashboards/763
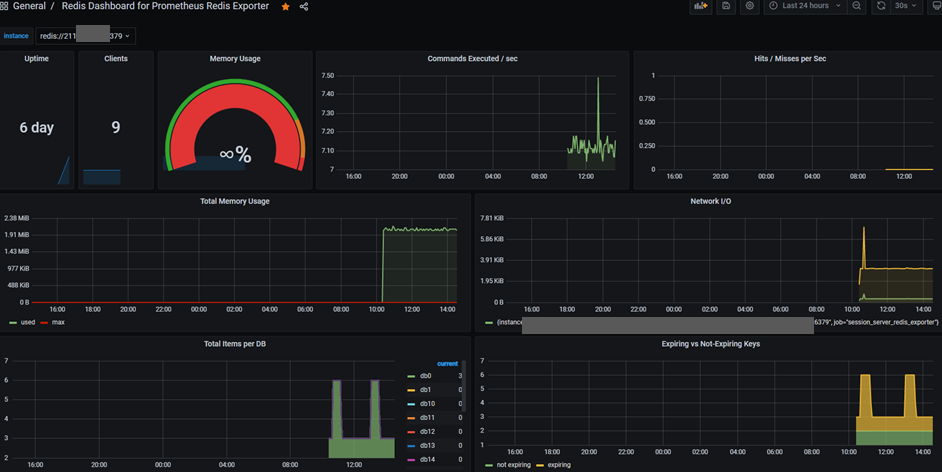
Memory Usage 부분이 안보이는데… 이건 확인을 좀 해봐야될 것 같습니다.
Nginx Exporter
prometheus exporters에서 nginx 메트릭 수집 exporter의 경우 nginx에 추가적인 설정이 필요하고 해당 exporter가 더 이상 유지보수가 되지 않기 때문에 nginx에서 제공하는 nginx-prometheus-exporter를 이용하는 것을 추천합니다.
참고: https://gurumee92.tistory.com/231
spring boot exporter
https://docs.spring.io/spring-boot/docs/current/reference/html/actuator.html
https://faun.pub/monitoring-springboot-application-with-prometheus-and-grafana-45c1023471e6
http://forward.nhnent.com/hands-on-labs/java.spring-boot-actuator/03-configuration.html#id3
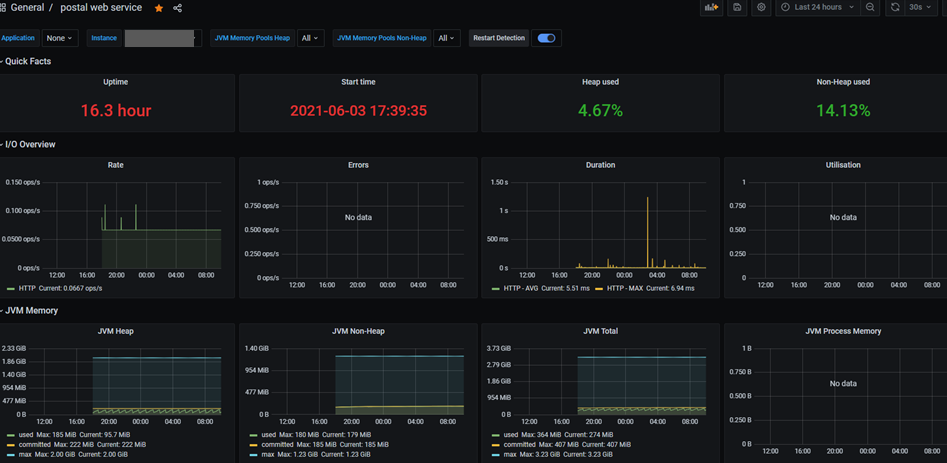
spring boot로 만든 애플리케이션을 prometheus - grafana로 모니터링 합니다.
build.gradle
dependencies {
    // ...
    implementation 'org.springframework.boot:spring-boot-starter-actuator'
    implementation "io.micrometer:micrometer-core"
    implementation "io.micrometer:micrometer-registry-prometheus"
    // ...
}
application.yml
spring:
  application:
    name: test
management:
  metrics:
    tags:
      application: ${spring.application.name}
  endpoint:
    metrics:
      enabled: true
    prometheus:
      enabled: true
  endpoints:
    web:
      exposure:
        include: health, info, prometheus
prometheus.yml 수정
# vim /usr/local/src/prometheus-2.27.1.linux-amd64/prometheus.yml 추가
 - job_name: 'test_service'
    metrics_path: '/actuator/prometheus'
    static_configs:
    - targets: ['xxxxxxxxx:8080']
# sudo systemctl restart prometheus
# sudo systemctl status prometheus
curl -i -X GET ‘http://222.xxx.xxx.xxx:8080/actuator/prometheus’
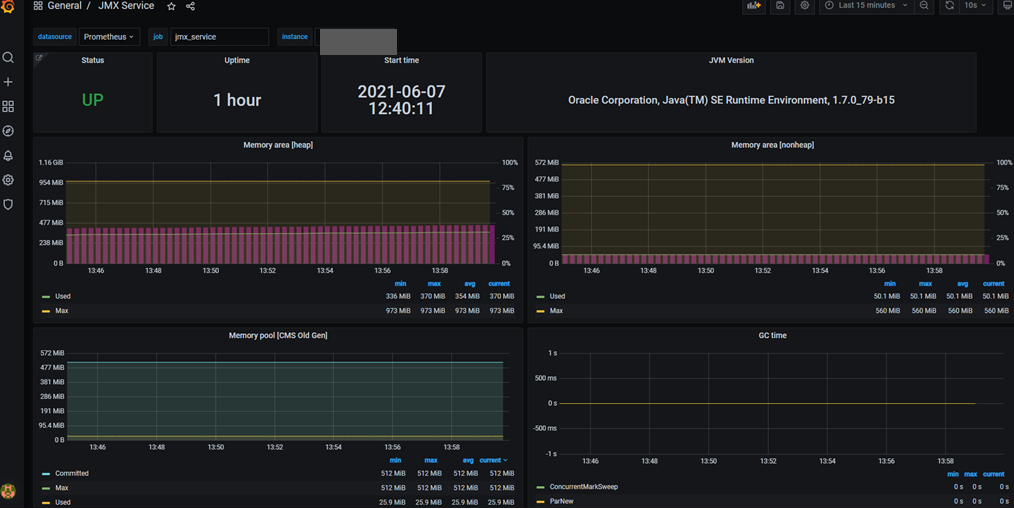
JVM dashboard import
https://grafana.com/grafana/dashboards/4701
spring boot가 아닌 서비스 모니터링하기
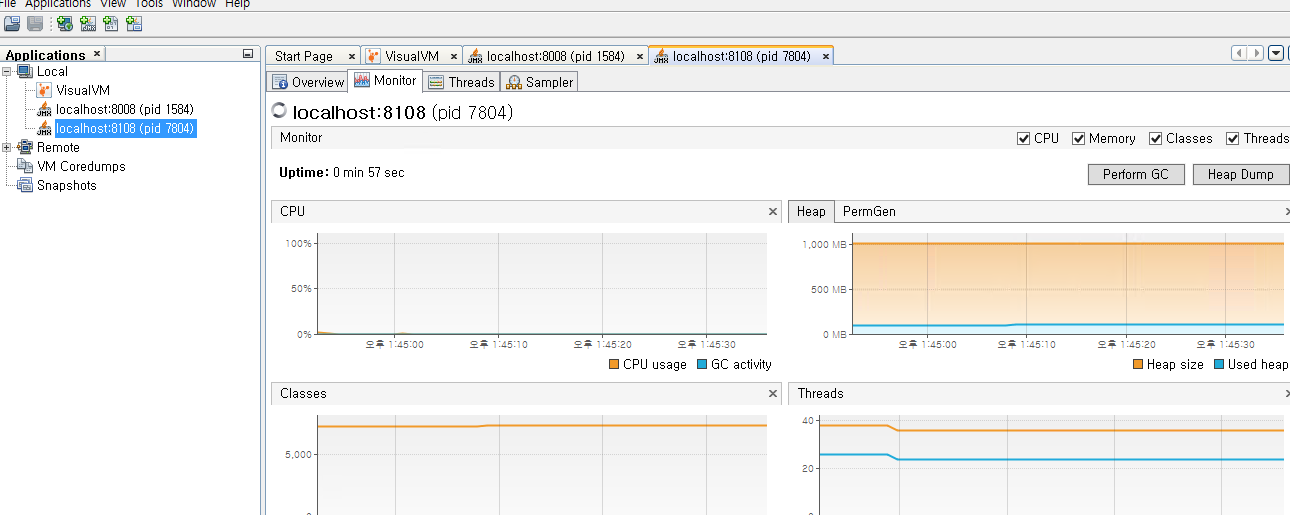
VisualVM으로 모니터링 하던 Window 기반의 오래된 서비스를 prometheus와 grafana로 모니터링 해봅시다.
jmx_exporter - github를 참고하였으며 설정 순서는 아래와 같습니다.
-
jar 다운로드 후 압축을 풉니다.
-
압축을 푼 폴더에서 config폴더를 만들고 서비스명_config.yaml 이름으로 파일을 만들고 아래와 같이 작성합니다.
startDelaySeconds: 0 ssl: false lowercaseOutputName: false lowercaseOutputLabelNames: false -
Window 작업표시줄에 tomcat service configure을 엽니다.
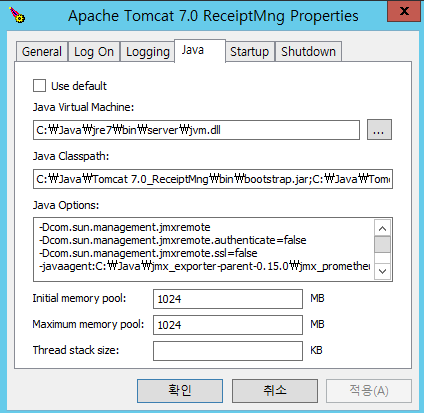
-
Java Tab에서 Java Options에서 추가합니다.
   -Dcom.sun.management.jmxremote
   -Dcom.sun.management.jmxremote.authenticate=false
   -Dcom.sun.management.jmxremote.ssl=false
   -javaagent:C:\Java\jmx_exporter-parent-0.15.0\jmx_prometheus_javaagent-0.15.0.jar=8181:C:\Java\jmx_exporter-parent-0.15.0\config\kdrmanager_8181_config.yaml
   ...
-
tomcat service 재시작 합니다.
-
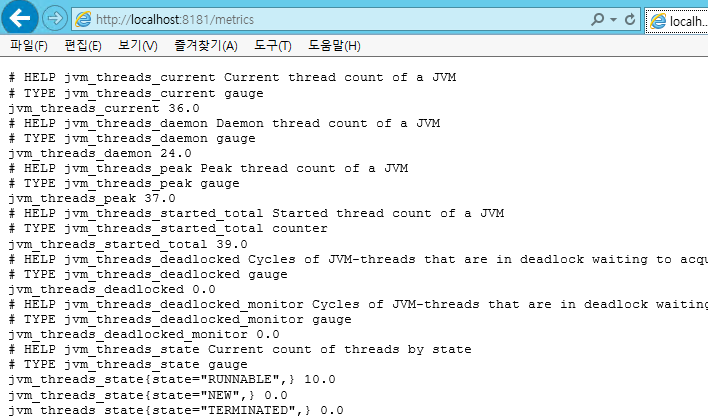
브라우저에서 http://localhost:8181/metrics 데이터를 확인합니다.
해당 서버의 방화벽 인바운드 규칙 8181포트 추가.
prometheus.yml 추가
  - job_name: 'kdrmanger_web_service'
    static_configs:
    - targets: ['211.xxx.xxx.xxx:8181']
  - job_name: 'onetouchpaymanager_web_service'
    static_configs:
    - targets: ['211.xxx.xxx.xxx:8182']
...
# sudo systemctl restart prometheus
Grafana
https://grafana.com/grafana/dashboards/8563
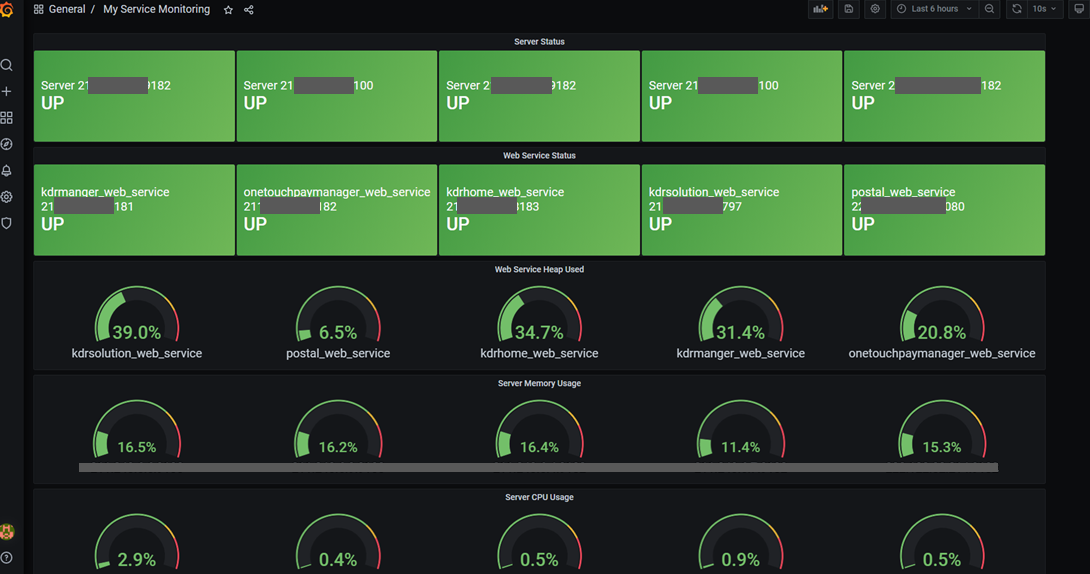
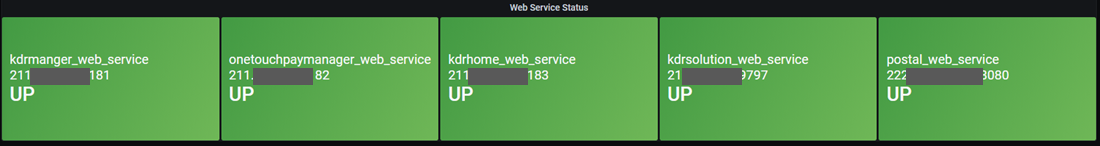
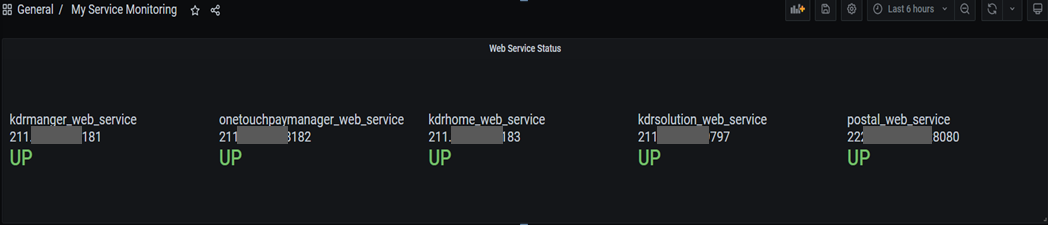
Custom Panel 구성하기
내가 원하는 정보만 화면에 표시하도록 구성할 수 있습니다.
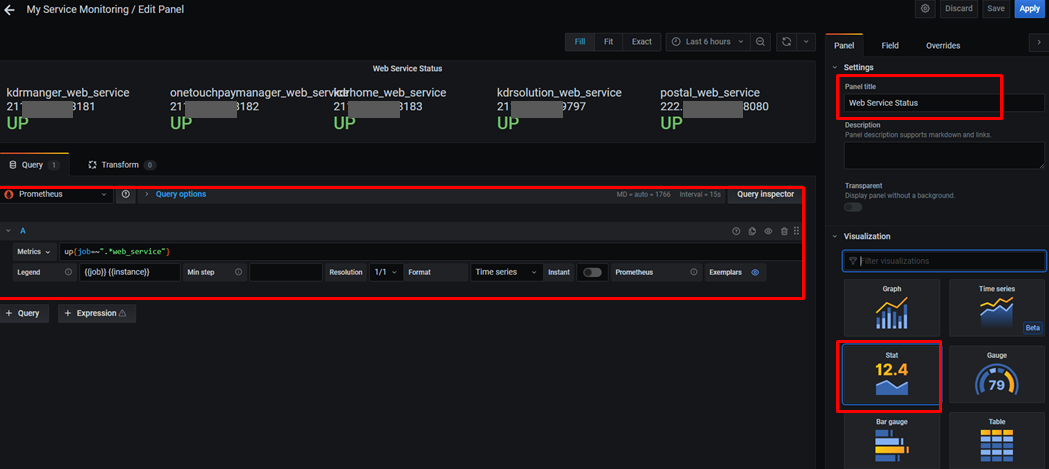
Metrics 쿼리를 지정합니다.
Metrics : up{job=~".*web_service"}     // web_service로 끝나는 job명을 조회
Legend : {{job}} {{instance}}          // 위에 표시할 이름(job명 instance명)

좌측 Panel에 Panel title을 입력하고, 플러그인 중 Stat을 선택합니다.

Graph mode : None
Text size Title: 20, Value: 30   //표시할 폰트 크기 지정.
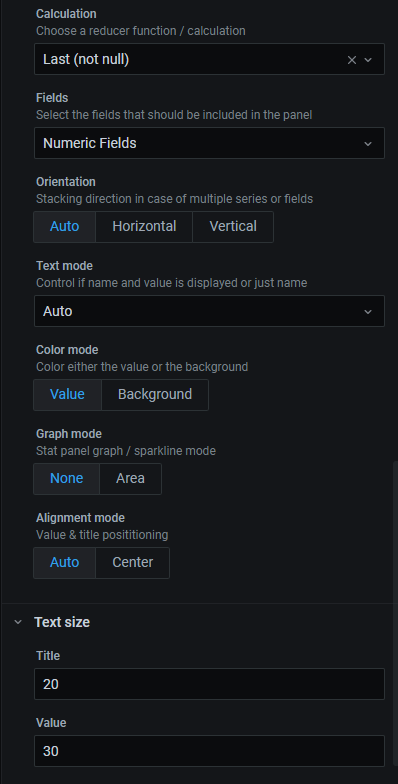
Color mode를 Background로 사용해도 괜찮습니다.
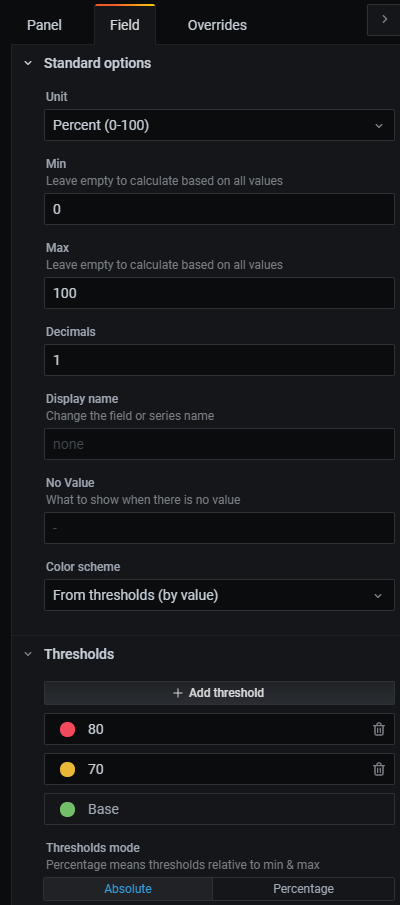
필드탭에서 아래와 같이 편집합니다.
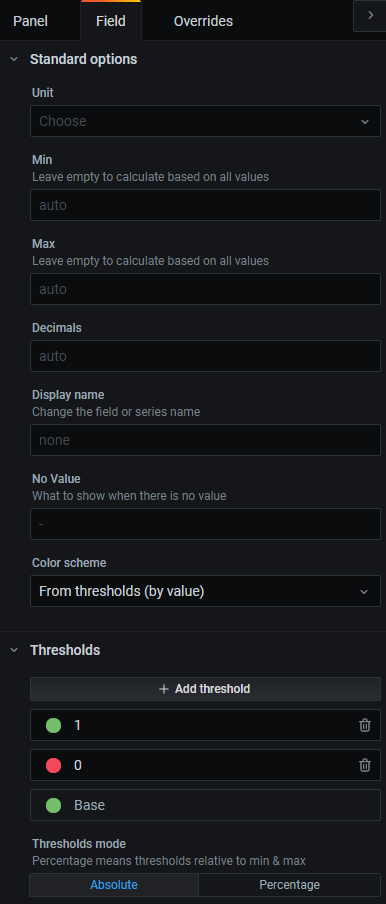
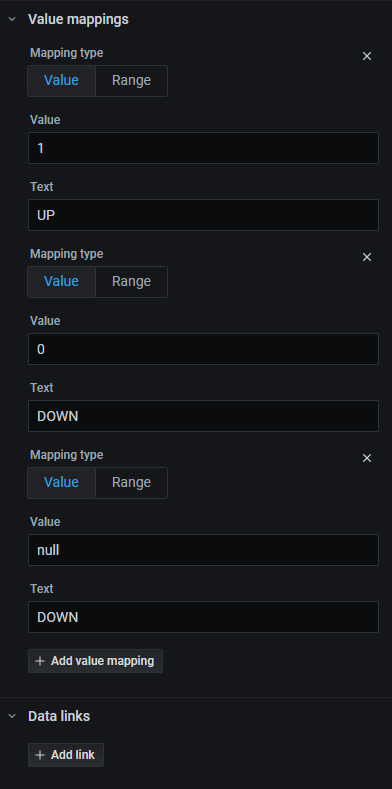
우측 상단에 Apply 버튼을 누르고 확인합니다.
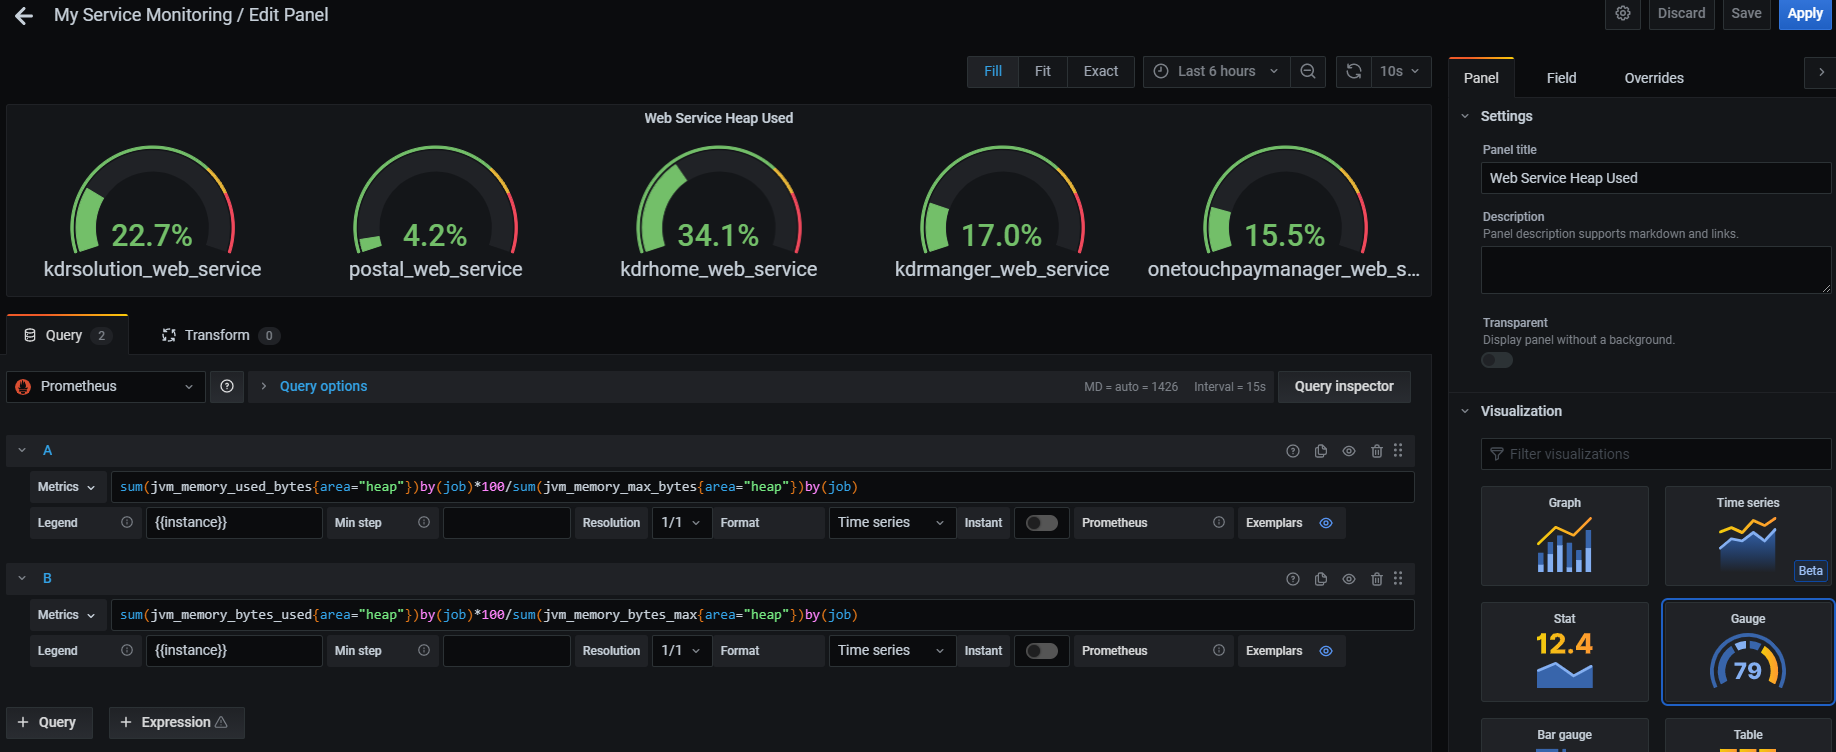
Heap 사용량 구하기
//adoptopenjdk 11(spring boot)
sum(jvm_memory_used_bytes{area="heap"})by(job)*100/sum(jvm_memory_max_bytes{area="heap"})by(job)

//oracle jdk 7(jmx exporter)
sum(jvm_memory_bytes_used{area="heap"})by(job)*100/sum(jvm_memory_bytes_max{area="heap"})by(job)
CPU 사용량
// Windows
100 - (avg by (instance) (irate(windows_cpu_time_total{mode="idle"}[2m])) * 100)

#Average
100 - (avg by (instance) (irate(windows_cpu_time_total{job=~"dev",mode="idle"}[2m])) * 100)
#Minimum
100 - (max by (instance) (irate(windows_cpu_time_total{job=~"dev",mode="idle"}[2m])) * 100)
#Maximum
100 - (min by (instance) (irate(windows_cpu_time_total{job=~"dev",mode="idle"}[2m])) * 100)

// Linux
(1 - avg(rate(node_cpu_seconds_total{mode="idle"}[2m])) by (instance)) * 100

#Average
100 - (avg by (instance) (irate(node_cpu_seconds_total{job="$job",mode="idle"}[5m])) * 100)
#Minimum
100 - (max by (instance) (irate(node_cpu_seconds_total{job="$job",mode="idle"}[5m])) * 100)
#Maximum
100 - (min by (instance) (irate(node_cpu_seconds_total{job="$job",mode="idle"}[5m])) * 100)
메모리 사용량
// Windows
(1 - (windows_os_physical_memory_free_bytes / (windows_cs_physical_memory_bytes)))* 100

#Average
100.0 - 100 * avg_over_time(windows_os_physical_memory_free_bytes{job=~"prod"}[30d]) / avg_over_time(windows_cs_physical_memory_bytes{job=~"prod"}[30d])
#Maximum
100.0 - 100 * min_over_time(windows_os_physical_memory_free_bytes{job=~"prod"}[30d]) / min_over_time(windows_cs_physical_memory_bytes{job=~"prod"}[30d])
#Minimum
100.0 - 100 * max_over_time(windows_os_physical_memory_free_bytes{job=~"prod"}[30d]) / max_over_time(windows_cs_physical_memory_bytes{job=~"prod"}[30d])

// Linux
(1 - (node_memory_MemAvailable_bytes / (node_memory_MemTotal_bytes)))* 100

#Avarege:
100 * (1 - ((avg_over_time(node_memory_MemFree_bytes{job=~"prod"}[30d]) + avg_over_time(node_memory_Cached_bytes{job=~"prod"}[30d]) + avg_over_time(node_memory_Buffers_bytes{job=~"prod"}[30d])) / avg_over_time(node_memory_MemTotal_bytes{job=~"prod"}[30d])))

#Maximum:
100 * (1 - ((min_over_time(node_memory_MemFree_bytes{job=~"prod"}[30d]) + min_over_time(node_memory_Cached_bytes{job=~"prod"}[30d]) + min_over_time(node_memory_Buffers_bytes{job=~"prod"}[30d])) / min_over_time(node_memory_MemTotal_bytes{job=~"prod"}[30d])))

#Minimum
100 * (1 - ((max_over_time(node_memory_MemFree_bytes{job=~"prod"}[30d]) + max_over_time(node_memory_Cached_bytes{job=~"prod"}[30d]) + max_over_time(node_memory_Buffers_bytes{job=~"prod"}[30d])) / max_over_time(node_memory_MemTotal_bytes{job=~"prod"}[30d])))
Grafana Alert로 Slack 전송
Prometheus에서 alertmanager를 설정해도 되지만, grafana에서 간단하게 alert를 할 수 있는 방법이 있습니다.
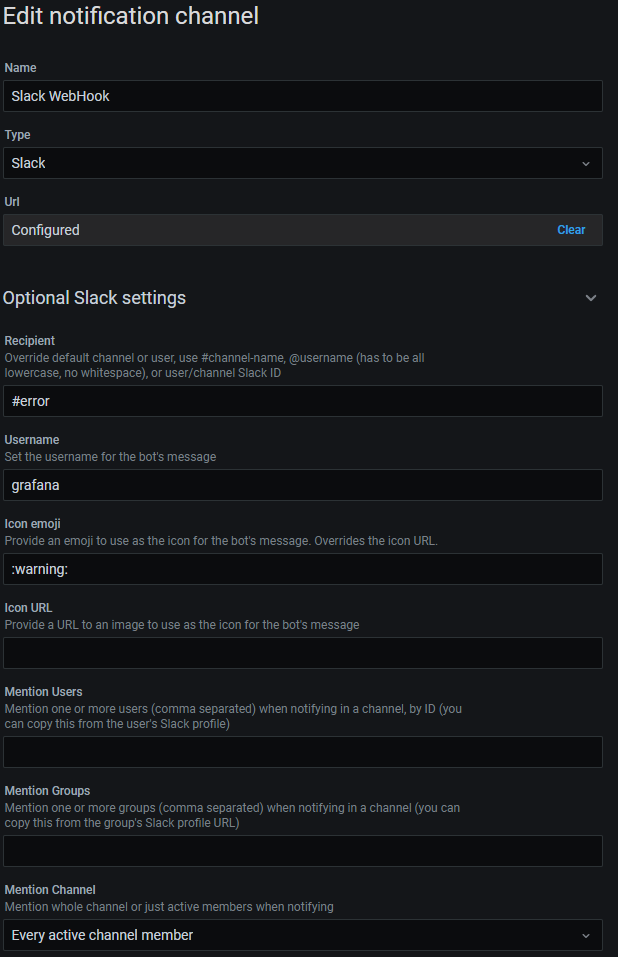
좌측 메뉴에서 알람 버튼을 클릭하고 Notification channels - New channel을 클릭합니다.
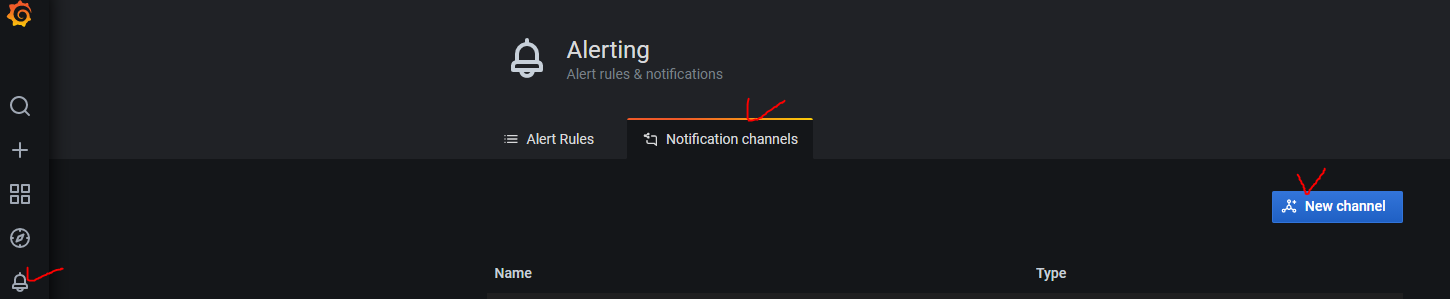
Slack에 메시지를 보내는 예제입니다. (최초 생성시 Url 부분에 Slack Webhook url을 입력합니다.)
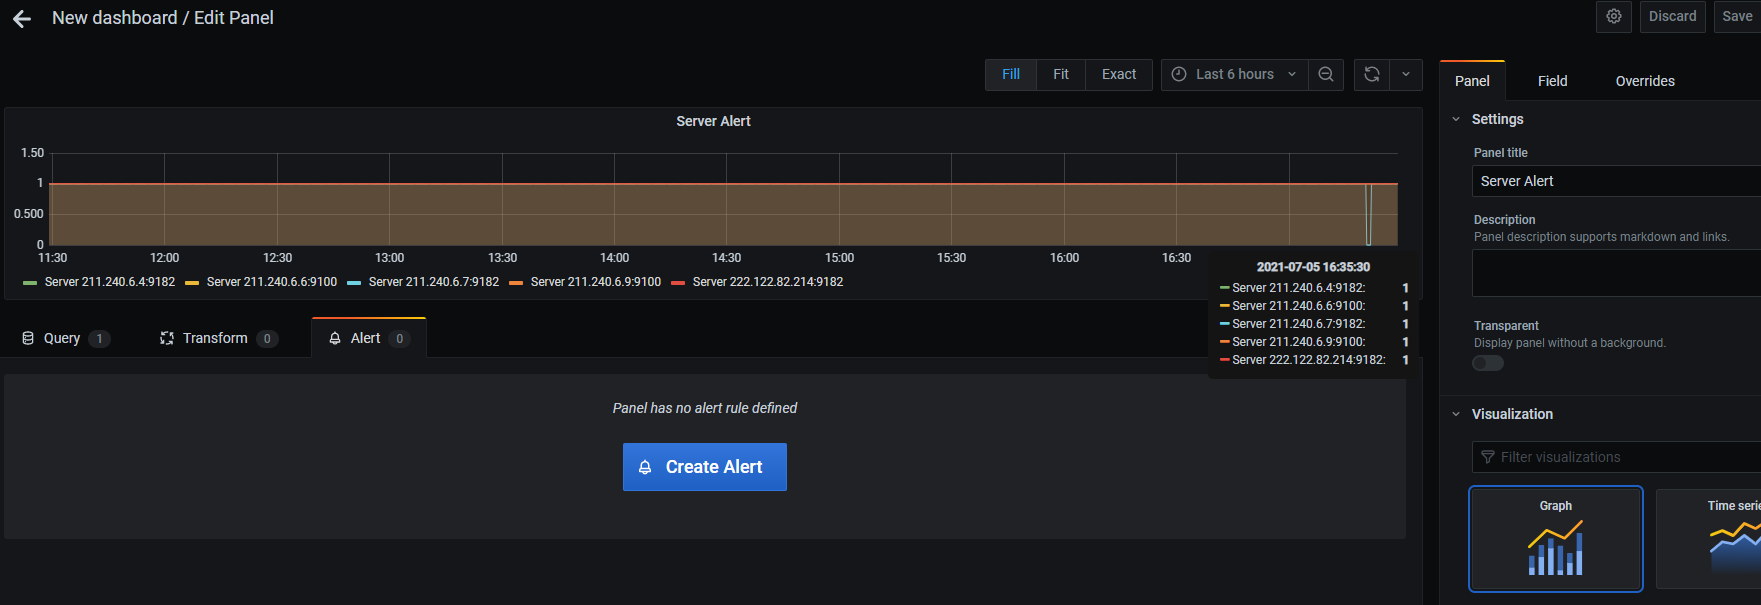
alert용 패널을 하나 추가하고 구성합니다.
단, 단일 상태 패널에는 경고를 추가할 수 없으므로 그래프 패널을 사용하여 경고를 추가해야 합니다.
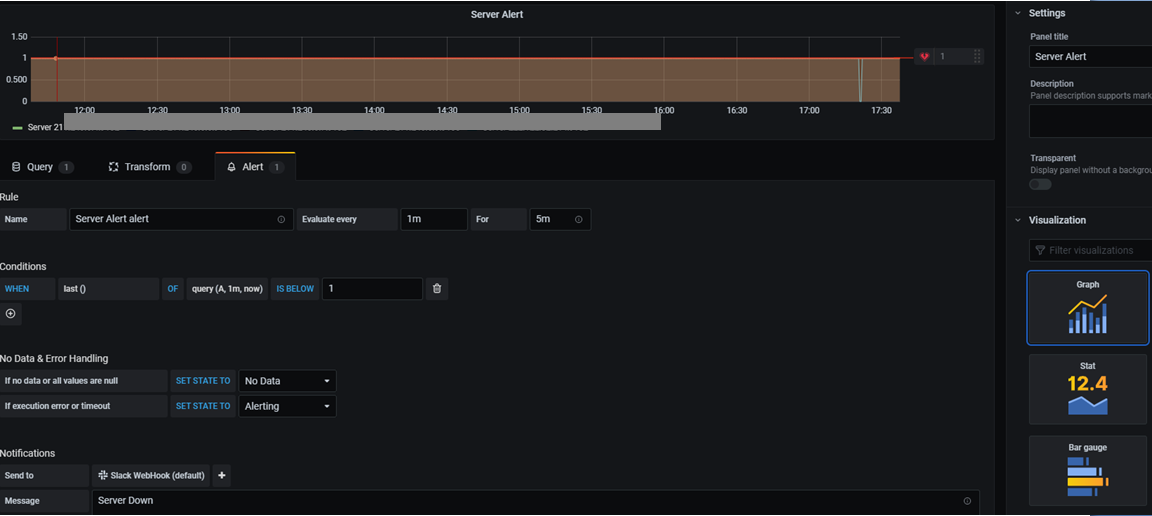
alert 조건을 입력합니다.
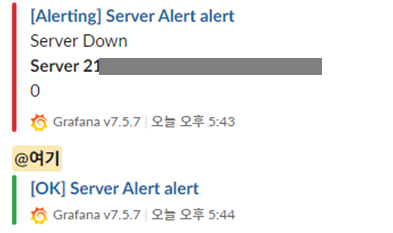
alert 조건이 만족되면 slack으로 메시지가 옵니다. (복구 시에도 알람이 옵니다.)
참고: https://medium.com/trendyol-tech/alert-and-monitoring-with-grafana-b659c433bb51
Prometheus alertmanager로 Slack 전송
https://prometheus.io/download/#alertmanager 에서 os에 맞는 버전을 다운받습니다.
# cd /usr/local/src
# wget https://github.com/prometheus/alertmanager/releases/download/v0.22.2/alertmanager-0.22.2.linux-amd64.tar.gz
# tar -xvf alertmanager-0.22.2.linux-amd64.tar.gz
# cd alertmanager-0.22.2.linux-amd64/
# ls
LICENSE NOTICE alertmanager alertmanager.yml amtool
slack 템플릿 신규 파일 작성
# vim slack-template.tmpl
{{ define "__alert_severity_prefix_title" -}}
    {{ if eq .Status "firing" -}}
        {{- if eq .CommonLabels.severity "critical" -}}
        :alert:
        {{- else -}}
        :warning:
        {{- end }}
    {{- else -}}
    :green_heart:
    {{- end }}
{{- end }}

{{ define "slack.title" -}}
    {{ template "__alert_severity_prefix_title" . }} {{ .CommonLabels.alertname }} {{ .Status }}
{{- end }}

{{ define "slack.icon_emoji" }}:prometheus:{{ end }}

{{ define "slack.text" -}}
    {{ range .Alerts }}
        {{- if .Annotations.message }}
            {{ .Annotations.message }}
        {{- end }}
        {{- if .Annotations.description }}
            {{ .Annotations.description }}
        {{- end }}
    {{- end }}
{{- end }}
# vim alertmanager.yml 수정
global:
  resolve_timeout: 1m
  slack_api_url: 'https://hooks.slack.com/services/T025A3C7J73/B0253LZJD7W/...'

route:
  group_by: ['alertname']
  group_wait: 10s
  group_interval: 1m
  repeat_interval: 1h
  receiver: 'slack-notification'
receivers:
  - name: 'slack-notification'
    slack_configs:
    - channel: '#error'
      send_resolved: true
      title: '{{ template "slack.title" . }}'
      icon_emoji: '{{ template "slack.icon_emoji" . }}'
      text: '{{ template "slack.text" . }}'
templates:
  - '/usr/local/src/alertmanager-0.22.2.linux-amd64/slack-template.tmpl'
# vim /usr/local/src/prometheus-2.27.1.linux-amd64/prometheus.yml 수정
# Alertmanager configuration
alerting:
  alertmanagers:
  - static_configs:
    - targets: ['211.xxx.xxx.xxx:9093']
      # - alertmanager:9093

rule_files:
  - "rules.yml"
# vim /usr/local/src/prometheus-2.27.1.linux-amd64/rules.yml 신규파일 작성
groups:
- name: Server
  rules:
  - alert: Server Down
    expr: up == 0
    for: 30s
    annotations:
      message: 'Instance {{ $labels.instance }} '
      description: 'labels={{ $labels }} Value={{ $value }}'
    labels:
      severity: 'critical'

  - alert: Server CPU Warnning
    expr: 100 - (avg by (instance) (irate(windows_cpu_time_total{mode="idle"}[1m])) * 100) > 70 or (1 - avg(rate(node_cpu_seconds_total{mode="idle"}[1m])) by (instance)) * 100 > 70
    for: 30s
    annotations:
      message: 'Instance {{ $labels.instance }} '
      description: 'labels={{ $labels }} Current Used={{ $value | printf "%.2f" }}%'
    labels:
      severity: 'warning'

  - alert: Server CPU Critical
    expr: 100 - (avg by (instance) (irate(windows_cpu_time_total{mode="idle"}[1m])) * 100) > 90 or (1 - avg(rate(node_cpu_seconds_total{mode="idle"}[1m])) by (instance)) * 100 > 90
    for: 30s
    annotations:
      message: 'Instance {{ $labels.instance }} '
      description: 'labels={{ $labels }} Current Used={{ $value | printf "%.2f" }}%'
    labels:
      severity: 'critical'

  - alert: Server Memory Warnning
    expr: (1 - (node_memory_MemAvailable_bytes / (node_memory_MemTotal_bytes))) * 100 > 70 or (1 - (windows_os_physical_memory_free_bytes / (windows_cs_physical_memory_bytes))) * 100 > 70
    for: 30s
    annotations:
      message: 'Instance {{ $labels.instance }} '
      description: 'labels={{ $labels }} Current Used={{ $value | printf "%.2f" }}%'
    labels:
      severity: 'warning'

  - alert: Server Memory Critical
    expr: (1 - (node_memory_MemAvailable_bytes / (node_memory_MemTotal_bytes))) * 100 > 90 or (1 - (windows_os_physical_memory_free_bytes / (windows_cs_physical_memory_bytes))) * 100 > 90
    for: 30s
    annotations:
      message: 'Instance {{ $labels.instance }} '
      description: 'labels={{ $labels }} Current Used={{ $value | printf "%.2f" }}%'
    labels:
      severity: 'critical'

  - alert: Heap Used Warnning
    expr: sum(jvm_memory_used_bytes{area="heap"})by(job)*100/sum(jvm_memory_max_bytes{area="heap"})by(job) > 70 or sum(jvm_memory_bytes_used{area="heap"})by(job)*100/sum(jvm_memory_bytes_max{area="heap"})by(job) > 70
    for: 30s
    annotations:
      message: 'Instance {{ $labels.instance }} '
      description: 'labels={{ $labels }} Current Used={{ $value | printf "%.2f" }}%'
    labels:
      severity: 'warning'

  - alert: Heap Used Critical
    expr: sum(jvm_memory_used_bytes{area="heap"})by(job)*100/sum(jvm_memory_max_bytes{area="heap"})by(job) > 90 or sum(jvm_memory_bytes_used{area="heap"})by(job)*100/sum(jvm_memory_bytes_max{area="heap"})by(job) > 90
    for: 30s
    annotations:
      message: 'Instance {{ $labels.instance }} '
      description: 'labels={{ $labels }} Current Used={{ $value | printf "%.2f" }}%'
    labels:
      severity: 'critical'
alertmanager 서비스 등록하기
# vim /etc/systemd/system/alertmanager.service
[Unit]
Description=Alertmanager
Wants=network-online.target
After=network-online.target

[Service]
User=root
Type=simple
ExecStart=/usr/local/src/alertmanager-0.22.2.linux-amd64/alertmanager --config.file=/usr/local/src/alertmanager-0.22.2.linux-amd64/alertmanager.yml --cluster.advertise-address=0.0.0.0:9093

[Install]
WantedBy=multi-user.target
# sudo systemctl daemon-reload
# sudo systemctl start alertmanager
# sudo systemctl status alertmanager
# sudo systemctl enable alertmanager
# sudo systemctl restart prometheus
# sudo systemctl status prometheus
# See all systemd logs
journalctl
# Tail logs
journalctl -f
# Show logs for specific service
journalctl -u prometheus
journalctl -u alertmanager
sudo journalctl -o verbose –unit=prometheus.service
**방화벽 설정 **
# sudo firewall-cmd –permanent –add-rich-rule=’rule family=”ipv4” source address=106.xxx.xxx.0/24 port port=”9093” protocol=”tcp” accept’
# firewall-cmd –reload
# firewall-cmd –list-all
alertmanager web ui 접속 확인
http://211.xxx.xxx.xxx:9093/
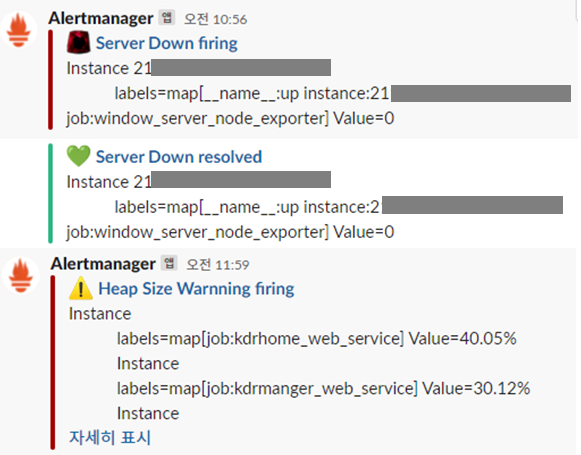
rule 조건에 맞으면 slack으로 메시지가 옵니다.
참고: https://prometheus.io/docs/alerting/latest/configuration/
https://github.com/prometheus/alertmanager
https://grafana.com/blog/2020/02/25/step-by-step-guide-to-setting-up-prometheus-alertmanager-with-slack-pagerduty-and-gmail/
참고:
https://prometheus.io/docs/introduction/overview/
https://owlyr.tistory.com/24
https://wiki.scn.sap.com/wiki/pages/viewpage.action?pageId=439649886
댓글남기기